Agua Fria leans slightly Democratic by roughly 12 points: about 56% of voters vote Democratic and 44% Republican.
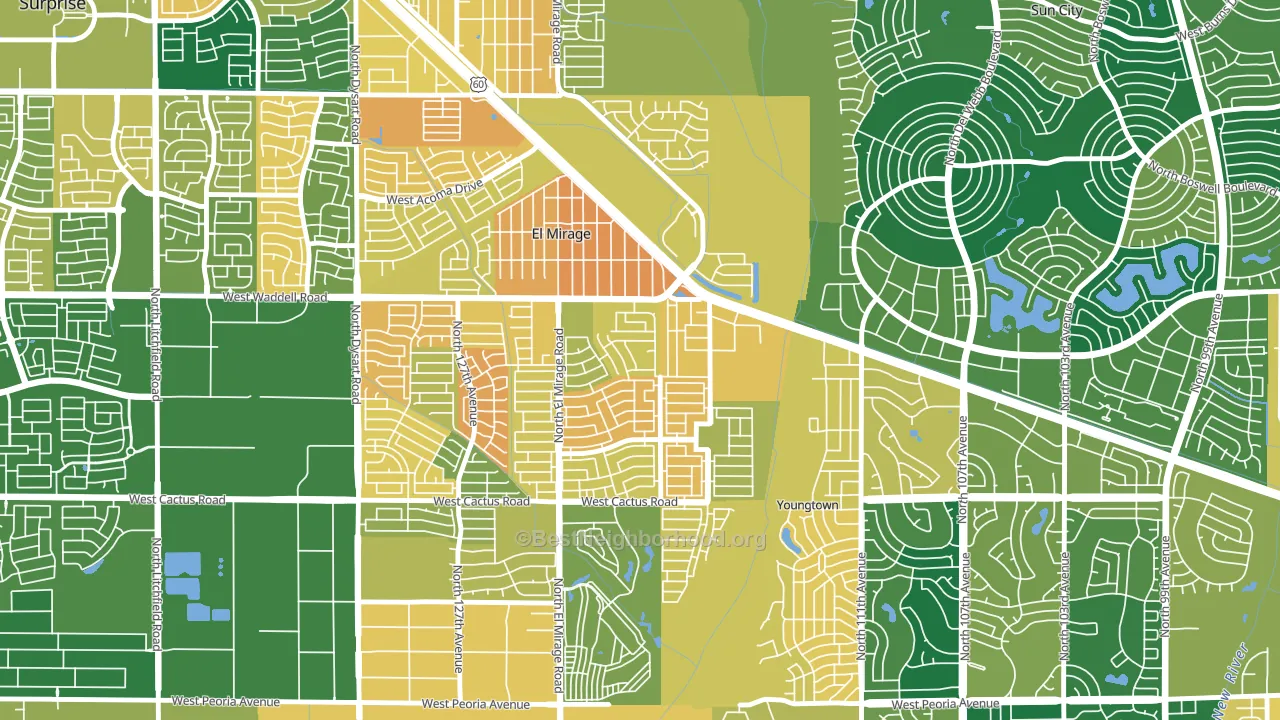
About 44% of adults in Agua Fria typically vote, below the U.S. average of about 62%. Among adults in Agua Fria, ~25% vote Democratic, ~19% Republican, and ~56% don't vote. The map below shows estimated turnout by block group.
How Agua Fria compares
Agua Fria sits in a sparsely populated area with few comparable neighborhoods nearby.
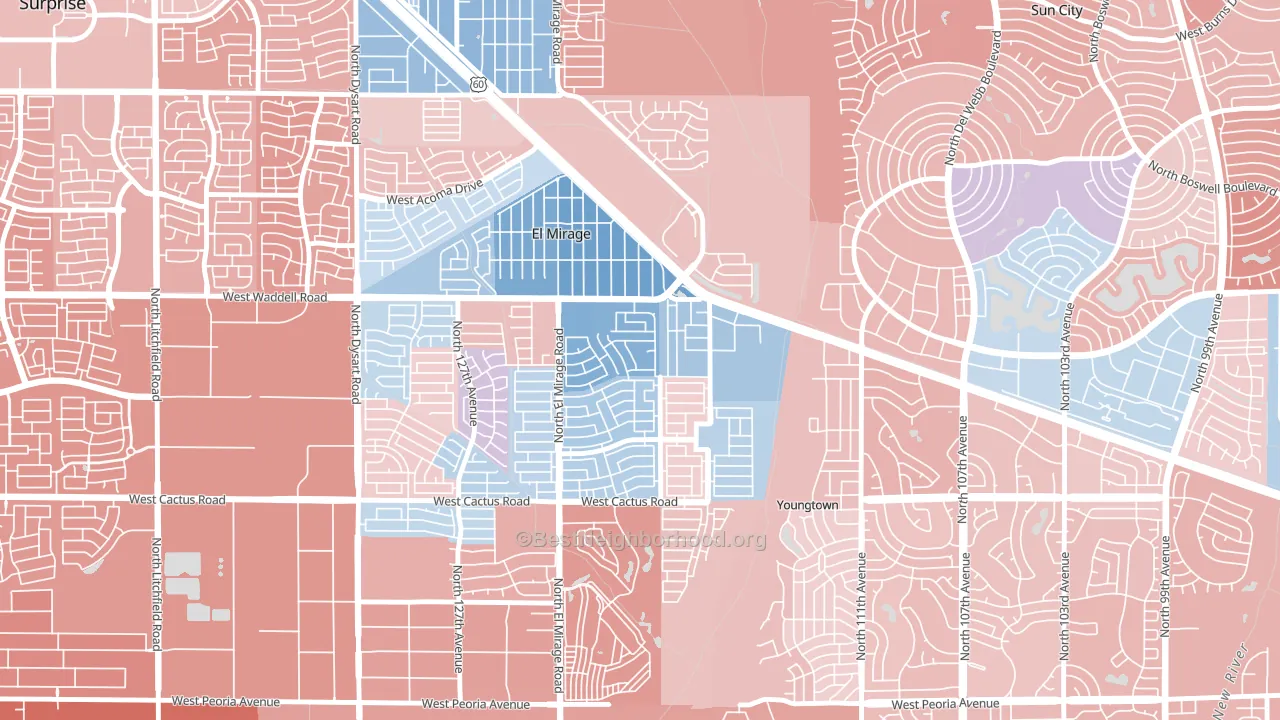
Agua Fria runs about 17 points more Democratic than Arizona as a whole. Arizona leans Republican overall, while Agua Fria is one of the few Democratic-leaning pockets.
Politics vary noticeably by block within Agua Fria. The north side is the most Democratic-leaning (D+26) and the southeast side is the least Democratic-leaning (Even), a spread of about 26 points.
Why Agua Fria leans the way it does
This analysis examined 14,881 data points per neighborhood to find what predicts political lean and turnout. The items below are a few correlations that stood out for Agua Fria, not a ranked or complete list of what matters most.
Agua Fria votes against the grain of Arizona. Arizona leans Republican overall, while Agua Fria runs about 17 points more Democratic.
Preventive-care access and voter turnout
Places with limited routine preventive-care access tend to turn out at a lower rate; Agua Fria, El Mirage, AZ sits in the bottom quarter nationally on this measure. Dental visits do not drive turnout; the rate reflects income, insurance, and healthcare access, which line up with who votes.
Why turnout in Agua Fria looks the way it does
Areas with limited routine healthcare access turn out at lower rates. Agua Fria is in the bottom quarter nationally for routine-care measures such as insurance coverage, preventive screenings, and dental visits. The dental-visit rate here is about 50%, about 10 points below the U.S. average of 60%. Crowded housing lines up with lower turnout, and about 11% of homes in Agua Fria have more than one occupant per room, above 92% of neighborhoods. Low high-school completion lines up with lower turnout, and about 76% of adults in Agua Fria have completed high school, below 90% of neighborhoods. Learn more about the findings and methodology on the political spectrum map.
Nearby Neighborhoods
- Ventana Lakes, Peoria, AZ R+24
- Alta Loma, Peoria, AZ R+3
- Peacock Village, Peoria, AZ R+17
- Camino Lago, Phoenix, AZ R+27
- Sierra Montana, Surprise, AZ R+20
- Surprise Farms, Surprise, AZ R+23
- Greenbriar, Glendale, AZ R+4
- Cactus Gale, Glendale, AZ R+11
- Ironwood Terrace, Glendale, AZ D+27
- Windsor Square, Glendale, AZ Even
Neighborhoods with Similar Populations
- North Hill Historic District, New Castle, PA R+5
- Plaza-Eastway, Charlotte, NC D+74
- University Park, Portland, OR D+63
- Nashboro Village, Nashville, TN D+39
- Royal Poinciana, Hollywood, FL D+20
- West University, Tucson, AZ D+58
- Downtown Normal, Normal, IL D+48
- Arrowhead, San Bernardino, CA D+10
- Lakeland, Baltimore, MD D+56
- Lindenville, South San Francisco, CA D+40
Sources and methodology
Precinct-level voting records used to fit the model come from Arizona Secretary of State, Elections, distributed by the Voting and Election Science Team. Demographic inputs come from the U.S. Census Bureau (ACS 5-year estimates and the 2020 Decennial Census). Health and environmental inputs come from the CDC (PLACES and the Environmental Justice Index). Land cover comes from the USGS and EPA. Election-day and lead-up weather come from PRISM 4km daily grids and the NOAA Global Historical Climatology Network. Mail-voting and election-administration patterns come from the MIT Election Lab's Survey of the Performance of American Elections. Block-group crime detail comes from CrimeGrade. Internet data and modeling support provided by ISPreports.org.
Modeling and analysis by the BestNeighborhood data science team. Full methodology and findings: political spectrum map.
Methodology reviewed by the BestNeighborhood data team. Last updated May 2026.