Alban Hills leans slightly Democratic by roughly 10 points: about 55% of voters vote Democratic and 45% Republican.
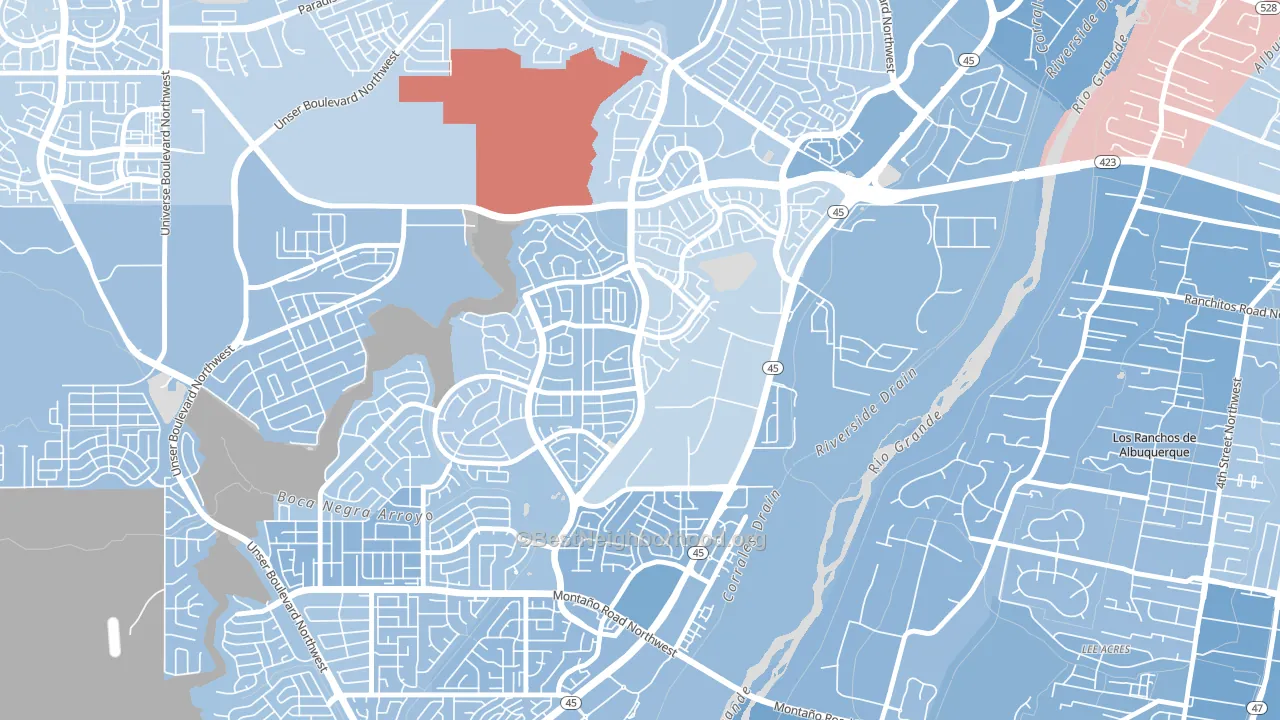
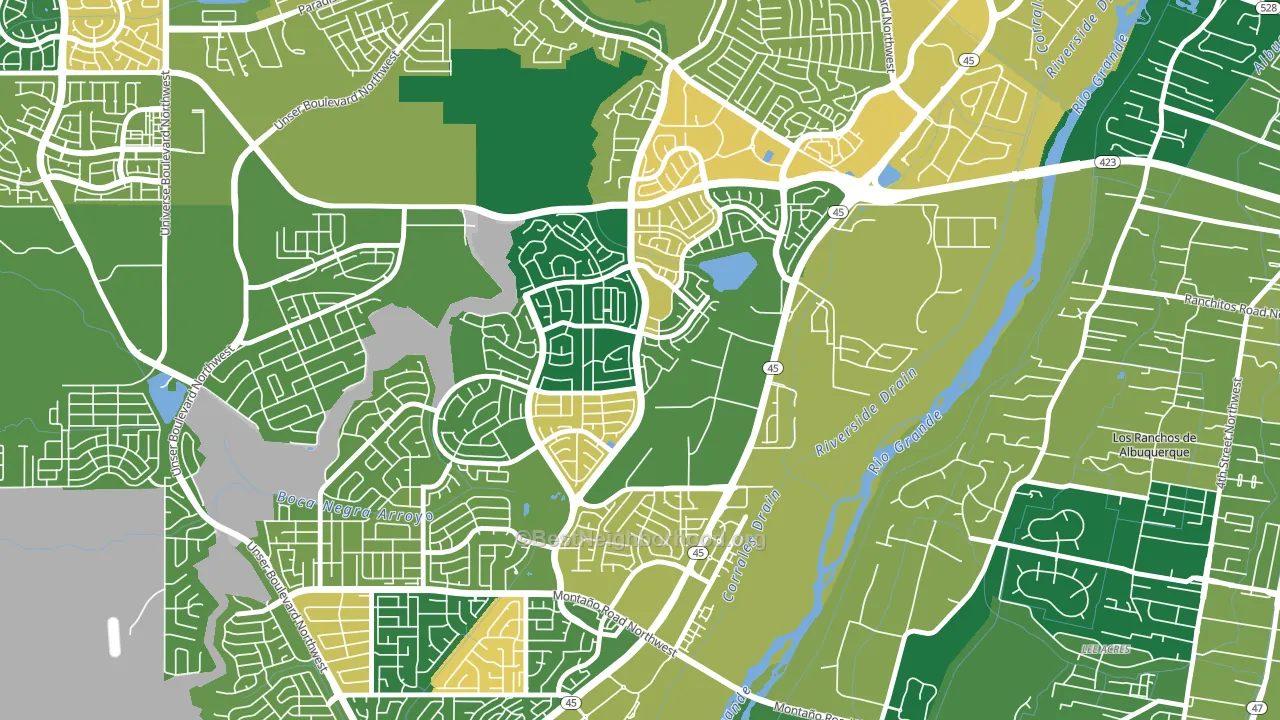
About 86% of adults in Alban Hills typically vote, above the U.S. average of about 62%. Among adults in Alban Hills, ~47% vote Democratic, ~39% Republican, and ~14% don't vote. The map below shows estimated turnout by block group.
How Alban Hills compares
Among neighborhoods within 5 miles, Alban Hills leans more Democratic than 1 of 9 neighbors.
Politically, Alban Hills sits close to the rest of New Mexico.
Why Alban Hills leans the way it does
Density, race composition, education, and family structure all sit close to their national averages in Alban Hills. The lean here lands roughly where demographic data alone would predict.
Renting and voter turnout
Places with homeowner-heavy households tend to turn out at a higher rate; Alban Hills, Albuquerque, NM sits in the bottom quarter nationally on this measure.
Why turnout in Alban Hills looks the way it does
Areas with strong routine healthcare access turn out at higher rates. Alban Hills is in the top quarter nationally for routine-care measures such as insurance coverage, preventive screenings, and dental visits. The dental-visit rate here is about 71%, about 11 points above the U.S. average of 60%. Homeowners vote more often than renters, and about 88% of households in Alban Hills own their home, above 85% of neighborhoods. Learn more about the findings and methodology on the political spectrum map.
Nearby Neighborhoods
- Taylor Ranch, Albuquerque, NM D+15
- Seven Bar Ranch, Albuquerque, NM D+21
- Skies West, Albuquerque, NM D+8
- Rio Grande, Albuquerque, NM D+40
- Alamedan Valley, North Valley, NM D+17
- Ladera West, Albuquerque, NM D+15
- Near N Valley, Albuquerque, NM D+42
- Vista del Norte, Albuquerque, NM D+17
- SR Marmon, Albuquerque, NM D+13
- Laurelwood, Albuquerque, NM D+18
Neighborhoods with Similar Populations
- Lewelling, Milwaukie, OR D+39
- Orem North, Orem, UT R+26
- North University, Tucson, AZ D+56
- Arctic, West Warwick, RI D+8
- Lower East, Santa Barbara, CA D+57
- Woodside Village, Largo, FL R+8
- Sedgefield, Charlotte, NC D+27
- Riverside Park, Fort Lauderdale, FL D+34
- Falcon Trace, Southchase, FL D+10
- Park East, Sarasota, FL D+13
Sources and methodology
Precinct-level voting records used to fit the model come from New Mexico Secretary of State, Bureau of Elections, distributed by the Voting and Election Science Team. Demographic inputs come from the U.S. Census Bureau (ACS 5-year estimates and the 2020 Decennial Census). Health and environmental inputs come from the CDC (PLACES and the Environmental Justice Index). Land cover comes from the USGS and EPA. Election-day and lead-up weather come from PRISM 4km daily grids and the NOAA Global Historical Climatology Network. Mail-voting and election-administration patterns come from the MIT Election Lab's Survey of the Performance of American Elections. Block-group crime detail comes from CrimeGrade. Internet data and modeling support provided by ISPreports.org.
Modeling and analysis by the BestNeighborhood data science team. Full methodology and findings: political spectrum map.
Methodology reviewed by the BestNeighborhood data team. Last updated May 2026.