Essex is a Democratic stronghold. About 91% of voters here vote Democratic and 9% Republican.
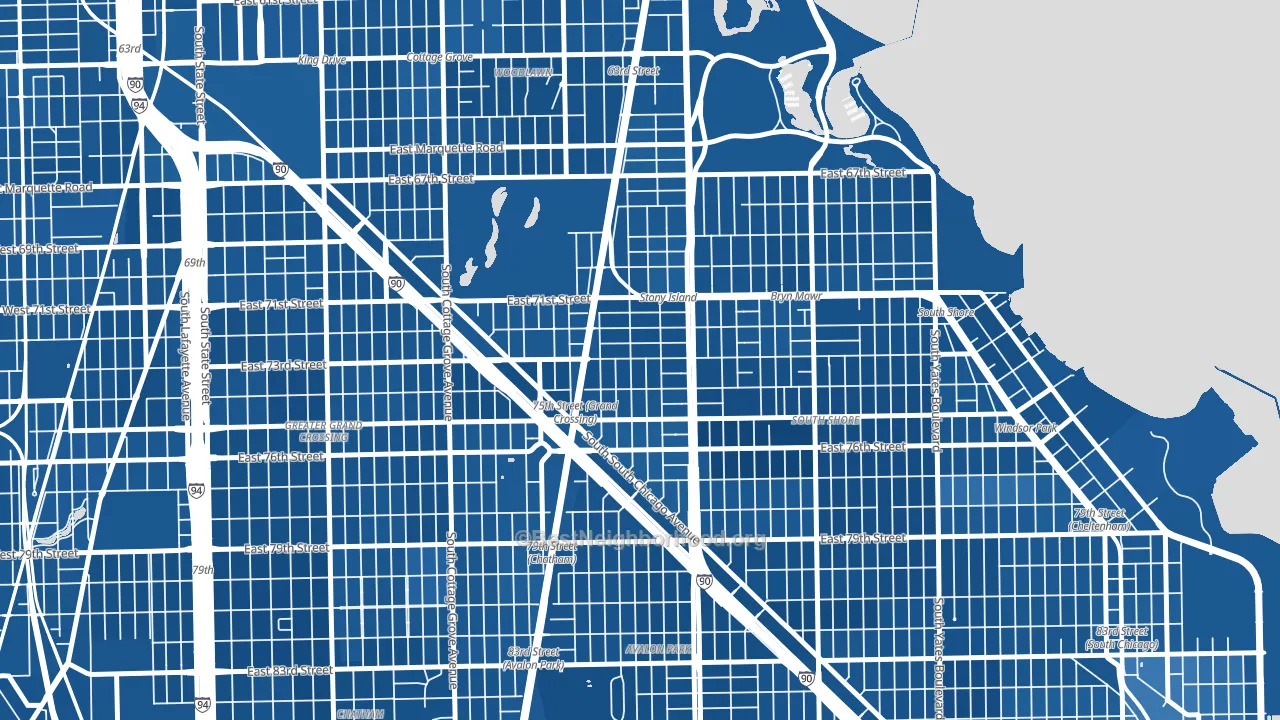
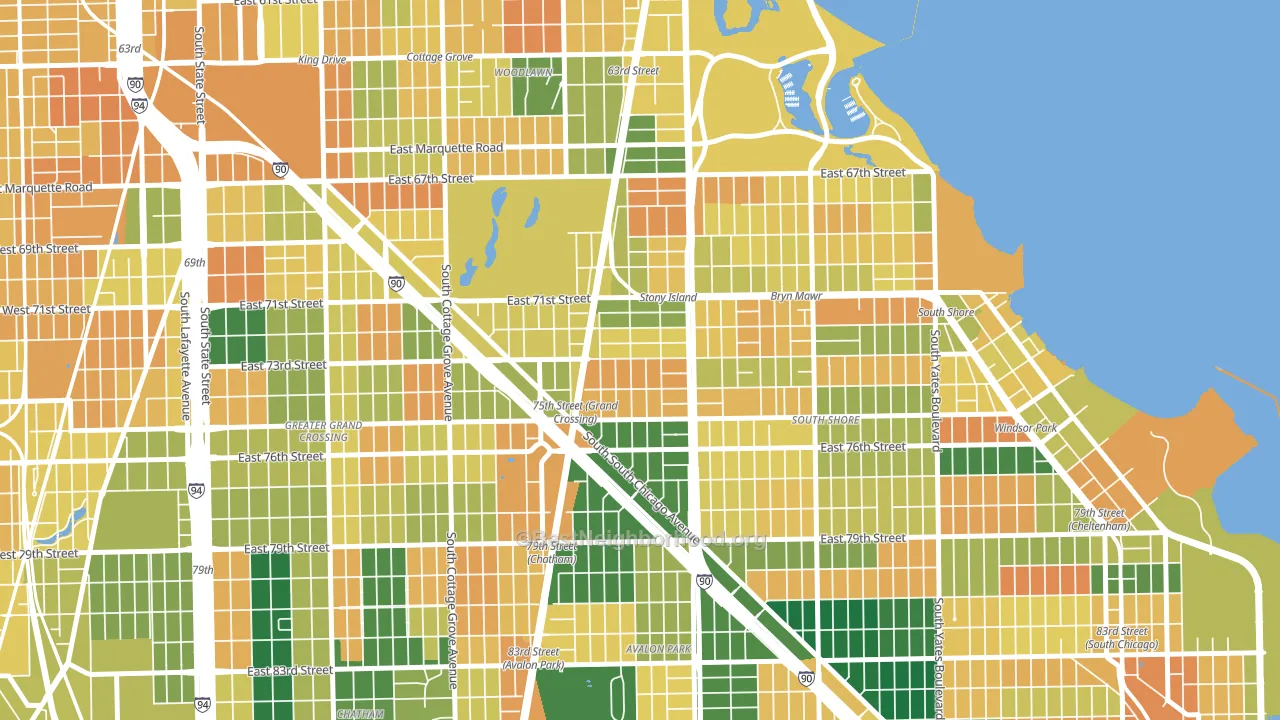
About 54% of adults in Essex typically vote, below the U.S. average of about 62%. Among adults in Essex, ~49% vote Democratic, ~5% Republican, and ~46% don't vote. The map below shows estimated turnout by block group.
How Essex compares
Among neighborhoods within 5 miles, Essex leans more Democratic than 18 of 32 neighbors.
Essex runs about 72 points more Democratic than Illinois as a whole.
Why Essex leans the way it does
This analysis examined 14,881 data points per neighborhood to find what predicts political lean and turnout. The items below are a few correlations that stood out for Essex, not a ranked or complete list of what matters most.
Dense areas vote Democratic. More than 99% of residents in Essex live in densely developed areas, about 64 points above the U.S. average of 36%. A high never-married share predicts Democratic voting, and about 54% of adults in Essex have never been married, above 88% of neighborhoods.
Paved land cover and Democratic lean
Places with extensive paved surfaces tend to lean Democratic; Essex, Chicago, IL sits in the top tenth nationally on this measure. Paved ground does not change how people vote; it mostly reflects how urban and built-up a place is.
Why turnout in Essex looks the way it does
Areas with high food insecurity turn out at lower rates. About 35% of adults in Essex report food insecurity, about 19 points above the U.S. average of 16%. High-crime urban areas turn out at lower rates, and Essex sits in the top 15% on a violent-crime measure. Learn more about the findings and methodology on the political spectrum map.
Nearby Neighborhoods
- South Shore, Chicago, IL D+83
- Italian Bowery, Chicago, IL D+82
- Avalon Highlands, Chicago, IL D+84
- Avalon Park, Chicago, IL D+86
- Woodlawn, Chicago, IL D+82
- Grand Crossing, Chicago, IL D+82
- Windsor Park, Chicago, IL D+81
- Cheltenham, Chicago, IL D+80
- Chatham, Chicago, IL D+85
- South Chicago, Chicago, IL D+76
Neighborhoods with Similar Populations
- The Boulevards, Canton, OH D+21
- Kabrich Crescent, Blacksburg, VA D+37
- Isle of Palms, Jacksonville Beach, FL R+39
- Spencer View Terrace, Deer Park, TX R+22
- Dover Heights, Toms River, NJ R+27
- Cody, Mobile, AL D+71
- North End, Phillipsburg, NJ D+6
- Downtown Belle Glade, Belle Glade, FL D+73
- Borchert Field, Milwaukee, WI D+88
- Buckingham Park, Willingboro, NJ D+78
Sources and methodology
Precinct-level voting records used to fit the model come from Illinois State Board of Elections, distributed by the Voting and Election Science Team. Demographic inputs come from the U.S. Census Bureau (ACS 5-year estimates and the 2020 Decennial Census). Health and environmental inputs come from the CDC (PLACES and the Environmental Justice Index). Land cover comes from the USGS and EPA. Election-day and lead-up weather come from PRISM 4km daily grids and the NOAA Global Historical Climatology Network. Mail-voting and election-administration patterns come from the MIT Election Lab's Survey of the Performance of American Elections. Block-group crime detail comes from CrimeGrade. Internet data and modeling support provided by ISPreports.org.
Modeling and analysis by the BestNeighborhood data science team. Full methodology and findings: political spectrum map.
Methodology reviewed by the BestNeighborhood data team. Last updated May 2026.