Bal Bay is a true toss-up. About 51% of voters here vote Democratic and 49% Republican.
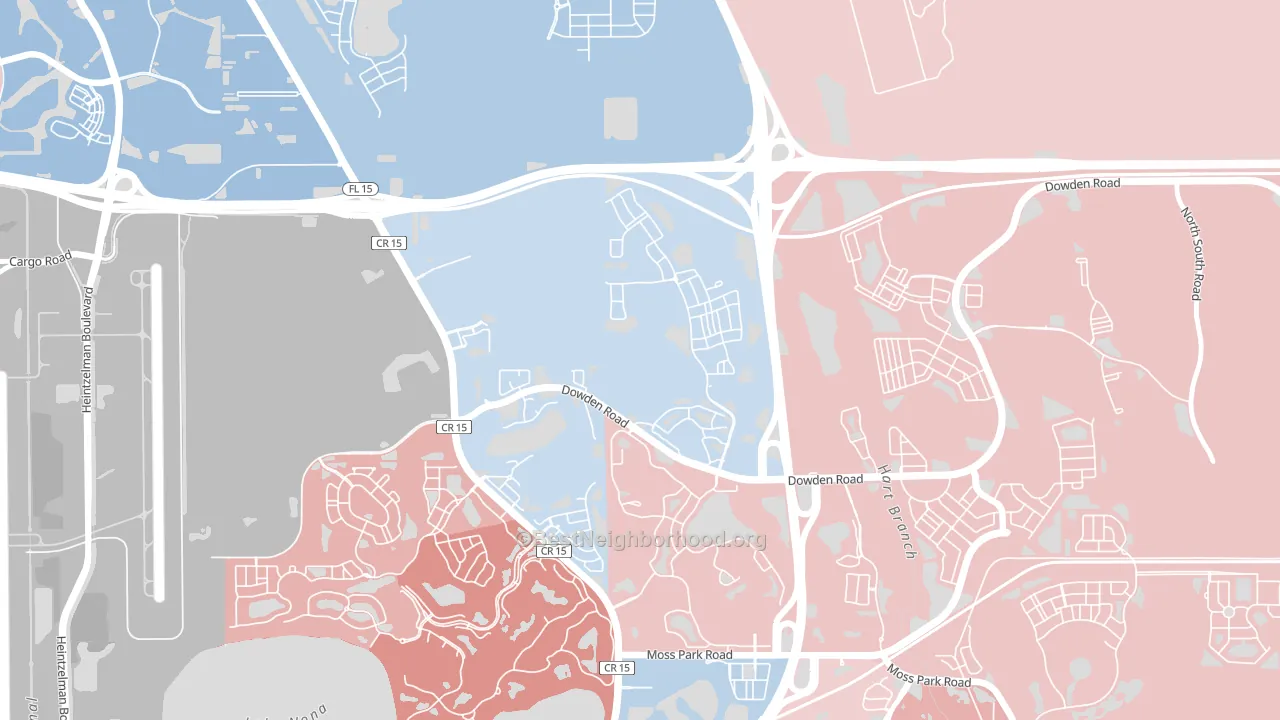
About 80% of adults in Bal Bay typically vote, above the U.S. average of about 62%. Among adults in Bal Bay, ~41% vote Democratic, ~39% Republican, and ~20% don't vote. The map below shows estimated turnout by block group.
How Bal Bay compares
Among neighborhoods within 5 miles, Bal Bay sits roughly in the middle of the political spectrum, with 2 neighbors leaning further in the place's direction and 2 leaning the other way.
Bal Bay runs about 15 points more Democratic than Florida as a whole. Florida leans Republican overall, while Bal Bay sits closer to the political middle.
Why Bal Bay leans the way it does
This analysis examined 14,881 data points per neighborhood to find what predicts political lean and turnout. The items below are a few correlations that stood out for Bal Bay, not a ranked or complete list of what matters most.
Bal Bay votes against the grain of Florida. Florida leans Republican overall, while Bal Bay runs about 15 points more Democratic.
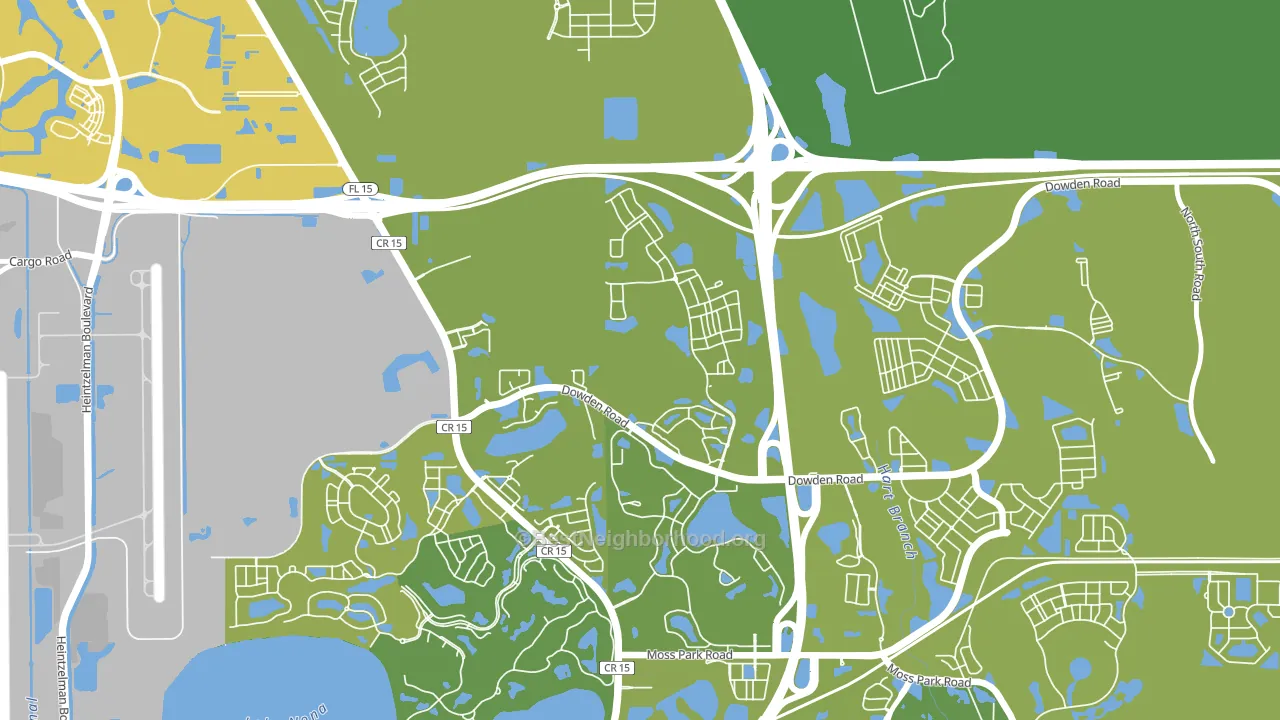
High-school completion and voter turnout
Places with high-school-completion-heavy adults tend to turn out at a higher rate; Bal Bay, Orlando, FL sits in the top tenth nationally on this measure.
Why turnout in Bal Bay looks the way it does
Areas with high high-school completion turn out at higher rates. About 99% of adults in Bal Bay have completed high school, about 10 points above the Florida average of 89%. Learn more about the findings and methodology on the political spectrum map.
Nearby Neighborhoods
- Northlake Park at Lake Nona, Orlando, FL R+6
- Vista East, Orlando, FL D+4
- Lake Nona, Orlando, FL R+4
- Airport North, Orlando, FL D+21
- South Semoran, Orlando, FL D+13
- Ventura, Orlando, FL D+11
- Lake Frederica, Orlando, FL D+19
- Raintree, Kissimmee, FL R+5
- Stoneybrook, Alafaya, FL Even
- Conway, Orlando, FL R+4
Neighborhoods with Similar Populations
- Highland Park, Seattle, WA D+59
- University Park, Dayton, OH D+23
- Richmond Factory, Augusta, GA D+53
- Lake Aumond, Augusta, GA D+25
- East Erie, Erie, PA D+47
- Tremont, Cleveland, OH D+55
- Southwest Hills, Portland, OR D+72
- Hartwell, Cincinnati, OH D+40
- South Side, West Palm Beach, FL Even
- Near North, Minneapolis, MN D+70
Sources and methodology
Precinct-level voting records used to fit the model come from Florida Division of Elections, distributed by the Voting and Election Science Team. Demographic inputs come from the U.S. Census Bureau (ACS 5-year estimates and the 2020 Decennial Census). Health and environmental inputs come from the CDC (PLACES and the Environmental Justice Index). Land cover comes from the USGS and EPA. Election-day and lead-up weather come from PRISM 4km daily grids and the NOAA Global Historical Climatology Network. Mail-voting and election-administration patterns come from the MIT Election Lab's Survey of the Performance of American Elections. Block-group crime detail comes from CrimeGrade. Internet data and modeling support provided by ISPreports.org.
Modeling and analysis by the BestNeighborhood data science team. Full methodology and findings: political spectrum map.
Methodology reviewed by the BestNeighborhood data team. Last updated May 2026.