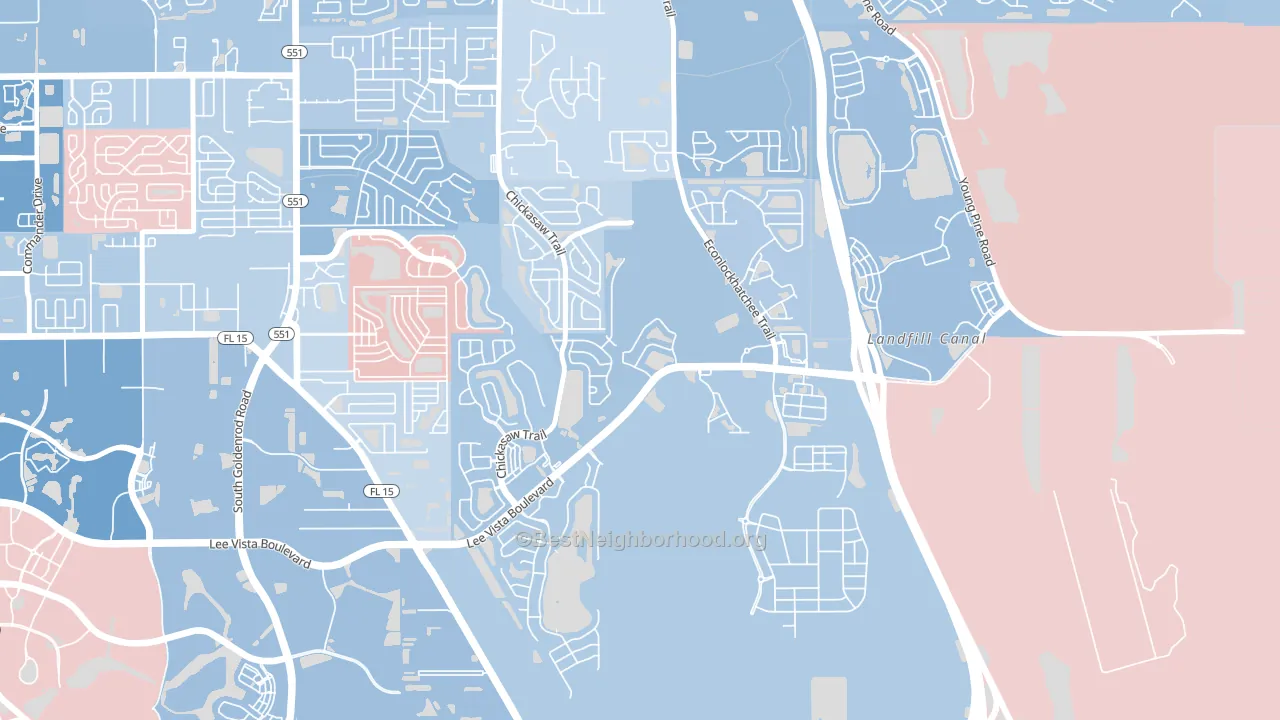
Vista East is a true toss-up. About 52% of voters here vote Democratic and 48% Republican.
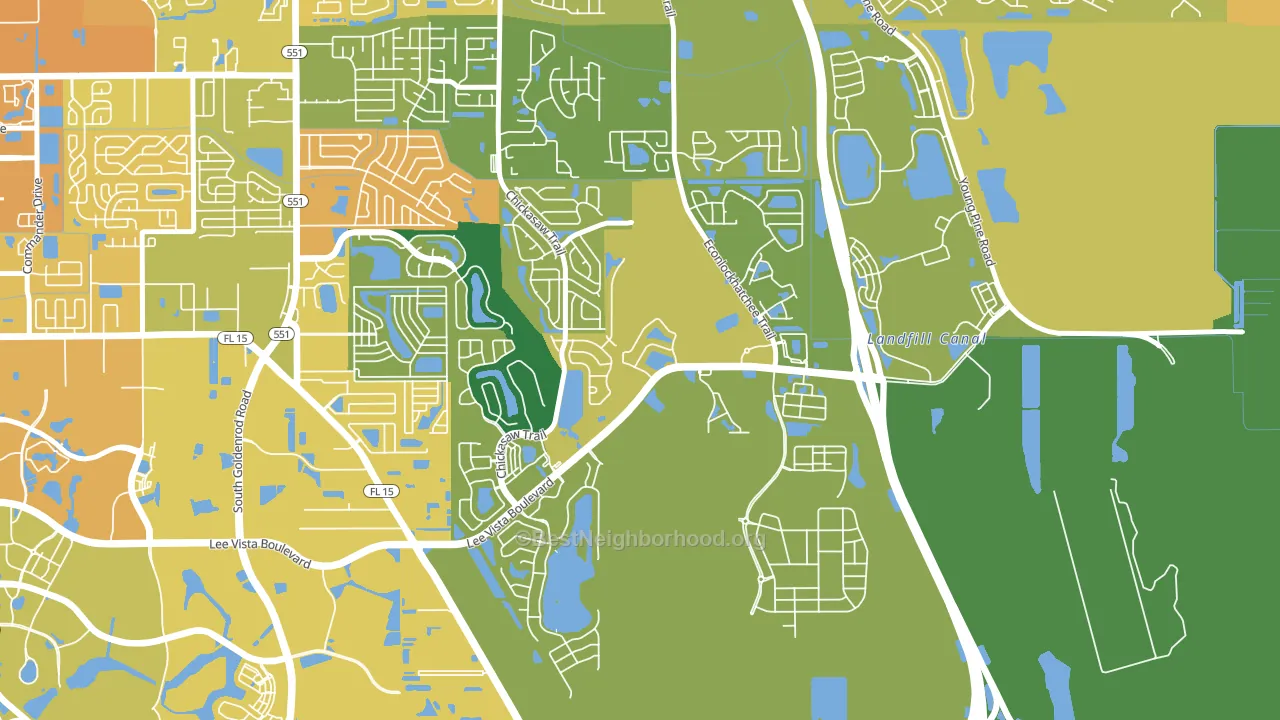
About 69% of adults in Vista East typically vote, above the U.S. average of about 62%. Among adults in Vista East, ~36% vote Democratic, ~33% Republican, and ~31% don't vote. The map below shows estimated turnout by block group.
How Vista East compares
Among neighborhoods within 5 miles, Vista East leans more Democratic than 3 of 10 neighbors.
Vista East runs about 17 points more Democratic than Florida as a whole. Florida leans Republican overall, while Vista East is one of the few Democratic-leaning pockets.
Politics vary noticeably by block within Vista East. The southeast side runs the most Democratic (D+6) and the northwest side runs the most Republican (R+9), a spread of about 15 points.
Why Vista East leans the way it does
This analysis examined 14,881 data points per neighborhood to find what predicts political lean and turnout. The items below are a few correlations that stood out for Vista East, not a ranked or complete list of what matters most.
Vista East votes against the grain of Florida. Florida leans Republican overall, while Vista East runs about 17 points more Democratic.
Developed land, local retail density, and voter turnout
Places that combine a rural land-use pattern and dense local retail within a mile tend to turn out at a higher rate, as Vista East, Orlando, FL does.
Why turnout in Vista East looks the way it does
Areas with limited routine healthcare access turn out at lower rates. Vista East is in the bottom quarter nationally for routine-care measures such as insurance coverage, preventive screenings, and dental visits. Learn more about the findings and methodology on the political spectrum map.
Nearby Neighborhoods
- Airport North, Orlando, FL D+21
- Bal Bay, Orlando, FL Even
- Ventura, Orlando, FL D+11
- South Semoran, Orlando, FL D+13
- Northlake Park at Lake Nona, Orlando, FL R+6
- Lake Frederica, Orlando, FL D+19
- Englewood Park, Orlando, FL D+17
- Legacy Place, Alafaya, FL D+13
- Mariners Village, Orlando, FL D+5
- Conway, Orlando, FL R+4
Neighborhoods with Similar Populations
- Myers Park, Charlotte, NC D+9
- Egger Highlands, San Diego, CA D+16
- Glenville, Cleveland, OH D+87
- Jenkins-Pinecroft, Shreveport, LA D+33
- Dumbo, Brooklyn, NY D+76
- Sky Line, San Diego, CA D+33
- River Mountain, Little Rock, AR D+9
- Windyke-Southwind, Memphis, TN D+46
- North and East, Richmond, CA D+55
- West 7th, St. Paul, MN D+59
Sources and methodology
Precinct-level voting records used to fit the model come from Florida Division of Elections, distributed by the Voting and Election Science Team. Demographic inputs come from the U.S. Census Bureau (ACS 5-year estimates and the 2020 Decennial Census). Health and environmental inputs come from the CDC (PLACES and the Environmental Justice Index). Land cover comes from the USGS and EPA. Election-day and lead-up weather come from PRISM 4km daily grids and the NOAA Global Historical Climatology Network. Mail-voting and election-administration patterns come from the MIT Election Lab's Survey of the Performance of American Elections. Block-group crime detail comes from CrimeGrade. Internet data and modeling support provided by ISPreports.org.
Modeling and analysis by the BestNeighborhood data science team. Full methodology and findings: political spectrum map.
Methodology reviewed by the BestNeighborhood data team. Last updated May 2026.