Behrman is a Democratic stronghold. About 89% of voters here vote Democratic and 11% Republican.
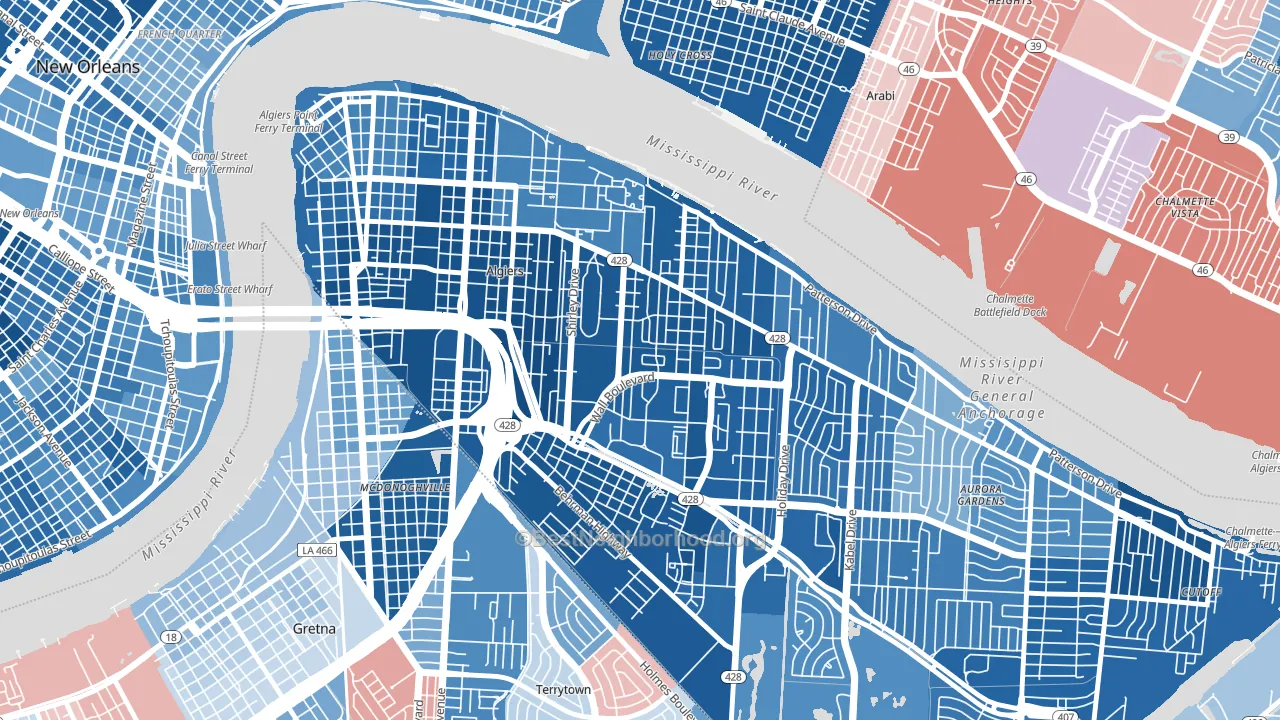
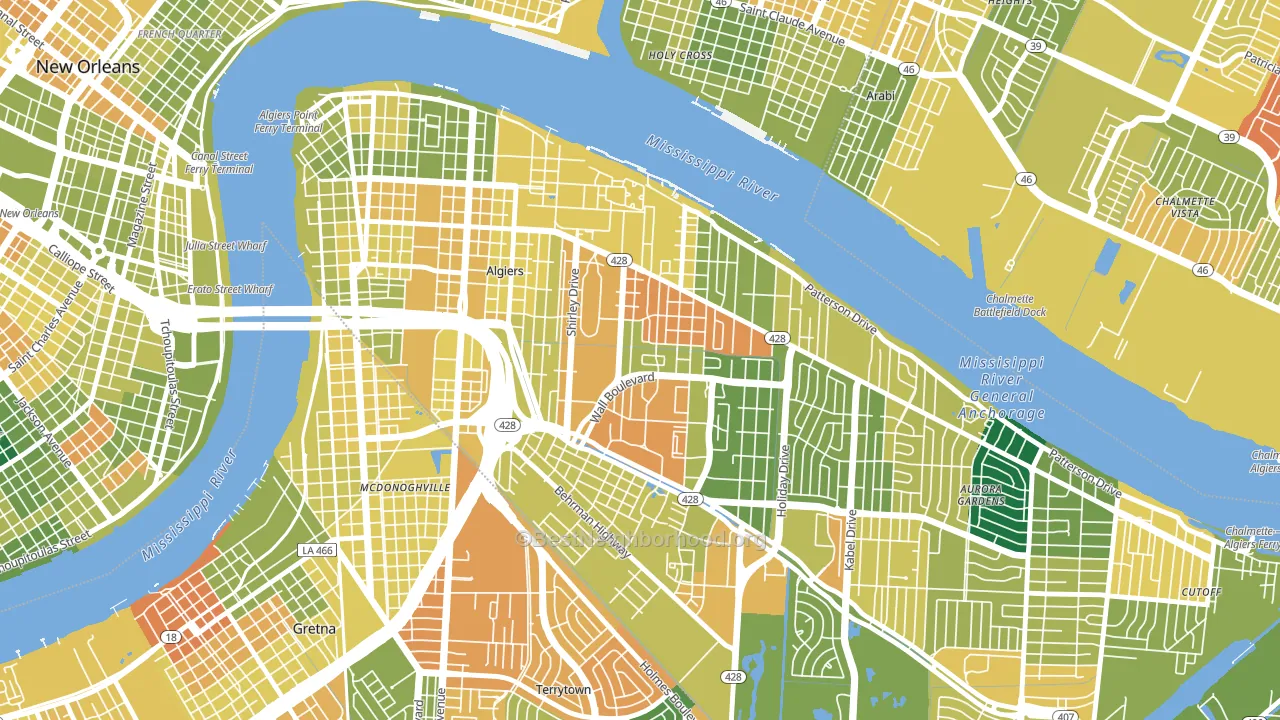
About 51% of adults in Behrman typically vote, below the U.S. average of about 62%. Among adults in Behrman, ~45% vote Democratic, ~6% Republican, and ~49% don't vote. The map below shows estimated turnout by block group.
How Behrman compares
Among neighborhoods within 5 miles, Behrman leans more Democratic than 22 of 24 neighbors.
Behrman runs about 101 points more Democratic than Louisiana as a whole. Louisiana leans Republican overall, while Behrman is one of the few Democratic-leaning pockets.
Politics vary noticeably by block within Behrman. The west side is the most Democratic-leaning (D+85) and the south side is the least Democratic-leaning (D+68), a spread of about 18 points.
Why Behrman leans the way it does
This analysis examined 14,881 data points per neighborhood to find what predicts political lean and turnout. The items below are a few correlations that stood out for Behrman, not a ranked or complete list of what matters most.
Density combined with diversity predicts Democratic voting. Non-Hispanic white share in Behrman is about 4%, about 69 points below the U.S. average of 72%. A high never-married share predicts Democratic voting, and about 53% of adults in Behrman have never been married, above 86% of neighborhoods. Behrman runs against the grain of Louisiana, a Democratic-leaning pocket in a Republican-leaning state.
High-school completion, developed land, and voter turnout
Places that combine low high-school-completion share and a heavily developed built environment tend to turn out at a lower rate, as Behrman, New Orleans, LA does.
Why turnout in Behrman looks the way it does
Areas with high food insecurity turn out at lower rates. About 42% of adults in Behrman report food insecurity, about 26 points above the U.S. average of 16%. Low high-school completion lines up with lower turnout, and about 83% of adults in Behrman have completed high school, below 81% of neighborhoods. Learn more about the findings and methodology on the political spectrum map.
Nearby Neighborhoods
- Holy Cross, New Orleans, LA D+77
- Old Aurora, New Orleans, LA D+56
- Tall Timbers, New Orleans, LA D+65
- Bywater, New Orleans, LA D+63
- Lower 9th Ward, New Orleans, LA D+80
- Saint Claude, New Orleans, LA D+71
- Lower Garden District, New Orleans, LA D+47
- French Quarter, New Orleans, LA D+46
- Central Business District, New Orleans, LA D+50
- Irish Channel, New Orleans, LA D+62
Neighborhoods with Similar Populations
- Charles, Providence, RI D+33
- Miramar, San Diego, CA R+20
- Mission-Foothill, Hayward, CA D+43
- Cheesman Park, Denver, CO D+72
- Marina, San Diego, CA D+45
- Heritage Hills, Austin, TX D+47
- Lakemont, Bellevue, WA D+41
- Kingfield, Minneapolis, MN D+82
- East Grove, Escondido, CA D+5
- Coves North, Kansas City, MO D+9
Sources and methodology
Precinct-level voting records used to fit the model come from Louisiana Secretary of State, Elections, distributed by the Voting and Election Science Team. Demographic inputs come from the U.S. Census Bureau (ACS 5-year estimates and the 2020 Decennial Census). Health and environmental inputs come from the CDC (PLACES and the Environmental Justice Index). Land cover comes from the USGS and EPA. Election-day and lead-up weather come from PRISM 4km daily grids and the NOAA Global Historical Climatology Network. Mail-voting and election-administration patterns come from the MIT Election Lab's Survey of the Performance of American Elections. Block-group crime detail comes from CrimeGrade. Internet data and modeling support provided by ISPreports.org.
Modeling and analysis by the BestNeighborhood data science team. Full methodology and findings: political spectrum map.
Methodology reviewed by the BestNeighborhood data team. Last updated May 2026.