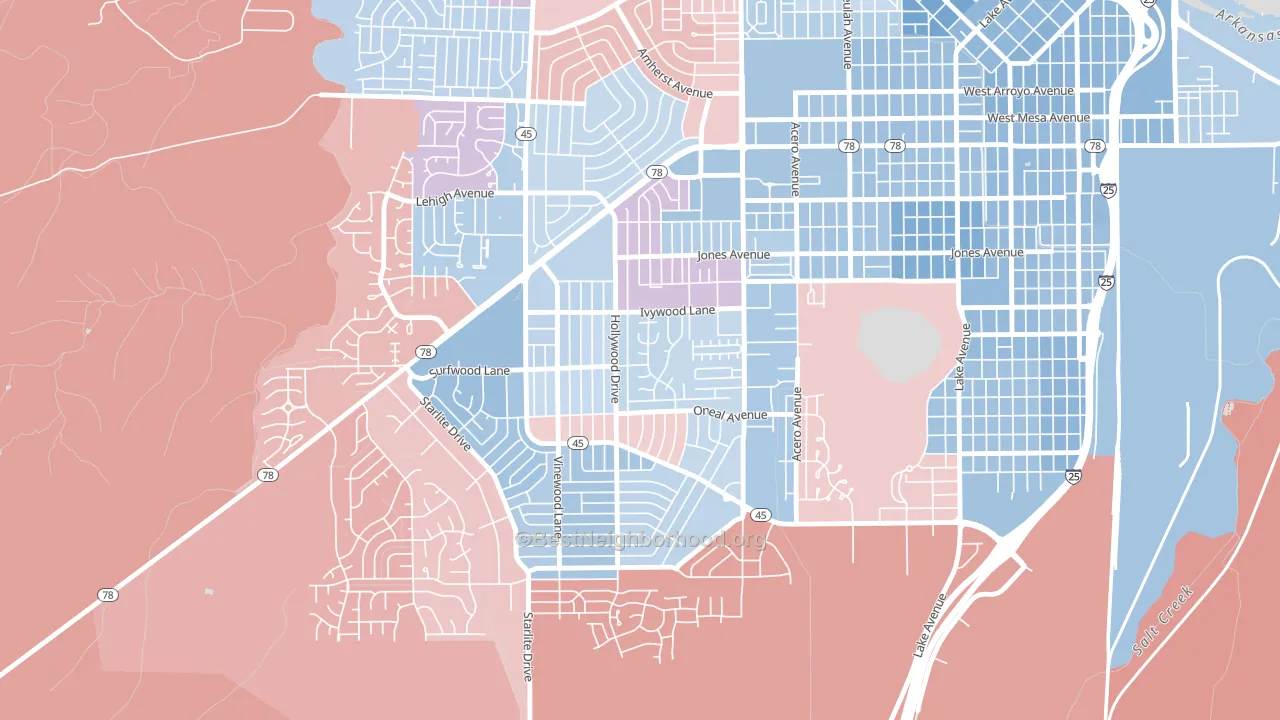
Beulah Heights leans slightly Democratic by roughly 10 points: about 55% of voters vote Democratic and 45% Republican.
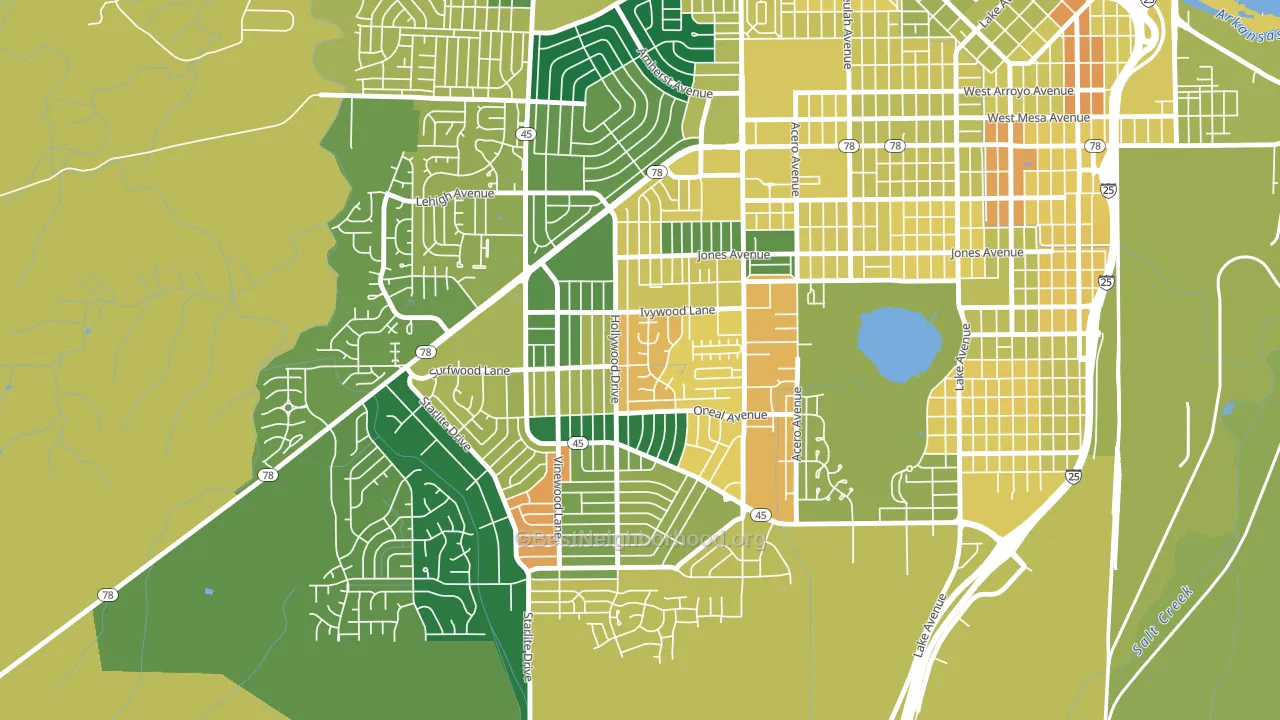
About 63% of adults in Beulah Heights typically vote, near the U.S. average of about 62%. Among adults in Beulah Heights, ~35% vote Democratic, ~28% Republican, and ~37% don't vote. The map below shows estimated turnout by block group.
How Beulah Heights compares
Among neighborhoods within 5 miles, Beulah Heights leans more Democratic than 4 of 9 neighbors.
Politically, Beulah Heights sits close to the rest of Colorado.
Why Beulah Heights leans the way it does
This analysis examined 14,881 data points per neighborhood to find what predicts political lean and turnout. The items below are a few correlations that stood out for Beulah Heights, not a ranked or complete list of what matters most.
Density combined with diversity predicts Democratic voting. Non-Hispanic white share in Beulah Heights is about 40%, about 32 points below the U.S. average of 72%.
Population density and Democratic lean
Places with high population density tend to lean Democratic; Beulah Heights, Pueblo, CO sits in the top quarter nationally on this measure.
Why turnout in Beulah Heights looks the way it does
Limited routine healthcare access lines up with lower turnout, and Beulah Heights sits in the bottom quarter on routine-care measures. Learn more about the findings and methodology on the political spectrum map.
Nearby Neighborhoods
- Sunset, Pueblo, CO D+4
- Regency, Pueblo, CO Even
- State Fair, Pueblo, CO D+15
- Sunnyheights, Pueblo, CO D+5
- Bessemer, Pueblo, CO D+17
- Aberdeen, Pueblo, CO D+13
- Mesa Junction, Pueblo, CO D+27
- Hyde Park, Pueblo, CO D+6
- Northside, Pueblo, CO D+17
- East Side, Pueblo, CO D+19
Neighborhoods with Similar Populations
- Duval, Jacksonville, FL R+21
- Rittersville, Allentown, PA D+10
- Barcroft, Arlington, VA D+48
- Westgate, Fargo, ND D+10
- Lowry Hill, Minneapolis, MN D+74
- Harbor, Ashtabula, OH R+7
- Middletown, San Diego, CA D+47
- Walnut Creek, Pembroke Pines, FL D+18
- Madison-Eastend, Baltimore, MD D+85
- North Meadow Brook, Norfolk, VA D+29
Sources and methodology
Precinct-level voting records used to fit the model come from Colorado Secretary of State, Elections, distributed by the Voting and Election Science Team. Demographic inputs come from the U.S. Census Bureau (ACS 5-year estimates and the 2020 Decennial Census). Health and environmental inputs come from the CDC (PLACES and the Environmental Justice Index). Land cover comes from the USGS and EPA. Election-day and lead-up weather come from PRISM 4km daily grids and the NOAA Global Historical Climatology Network. Mail-voting and election-administration patterns come from the MIT Election Lab's Survey of the Performance of American Elections. Block-group crime detail comes from CrimeGrade. Internet data and modeling support provided by ISPreports.org.
Modeling and analysis by the BestNeighborhood data science team. Full methodology and findings: political spectrum map.
Methodology reviewed by the BestNeighborhood data team. Last updated May 2026.