Boca Teeca is a true toss-up. About 50% of voters here vote Democratic and 50% Republican.
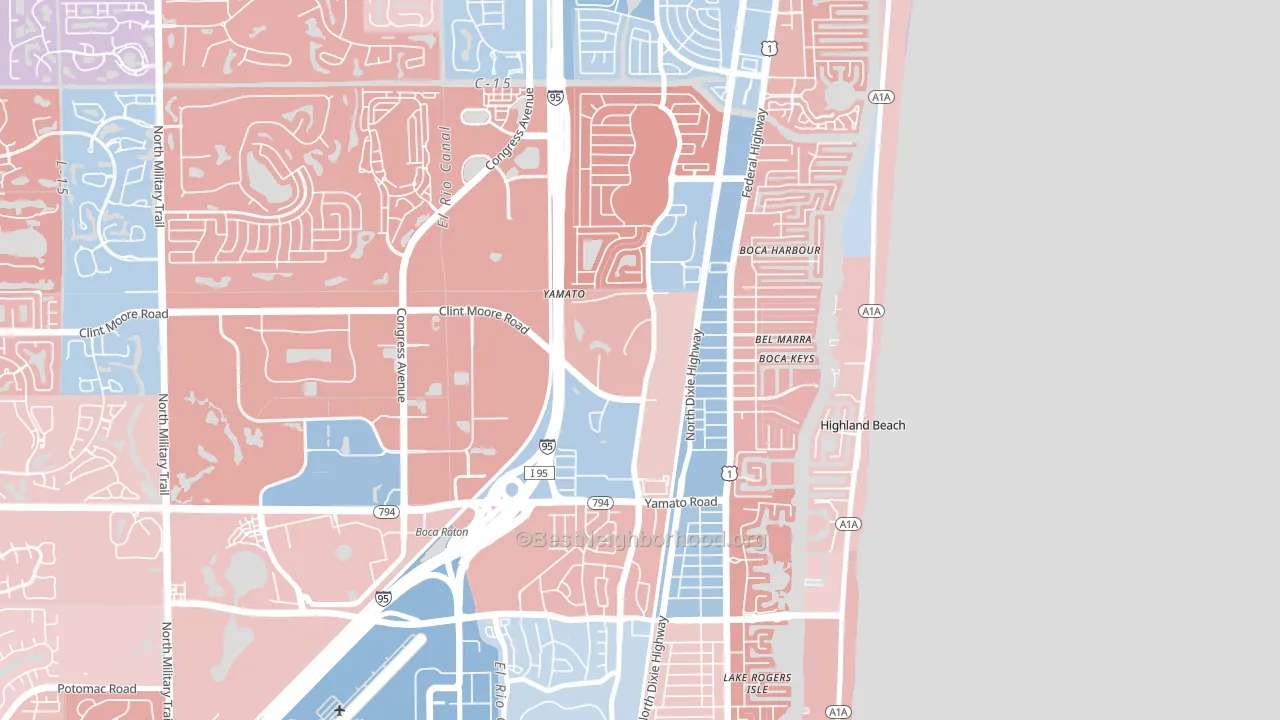
About 69% of adults in Boca Teeca typically vote, above the U.S. average of about 62%. Among adults in Boca Teeca, ~35% vote Democratic, ~35% Republican, and ~30% don't vote. The map below shows estimated turnout by block group.
How Boca Teeca compares
Boca Teeca runs about 12 points more Democratic than Florida as a whole.
Why Boca Teeca leans the way it does
Density, race composition, education, and family structure all sit close to their national averages in Boca Teeca. The lean here lands roughly where demographic data alone would predict.
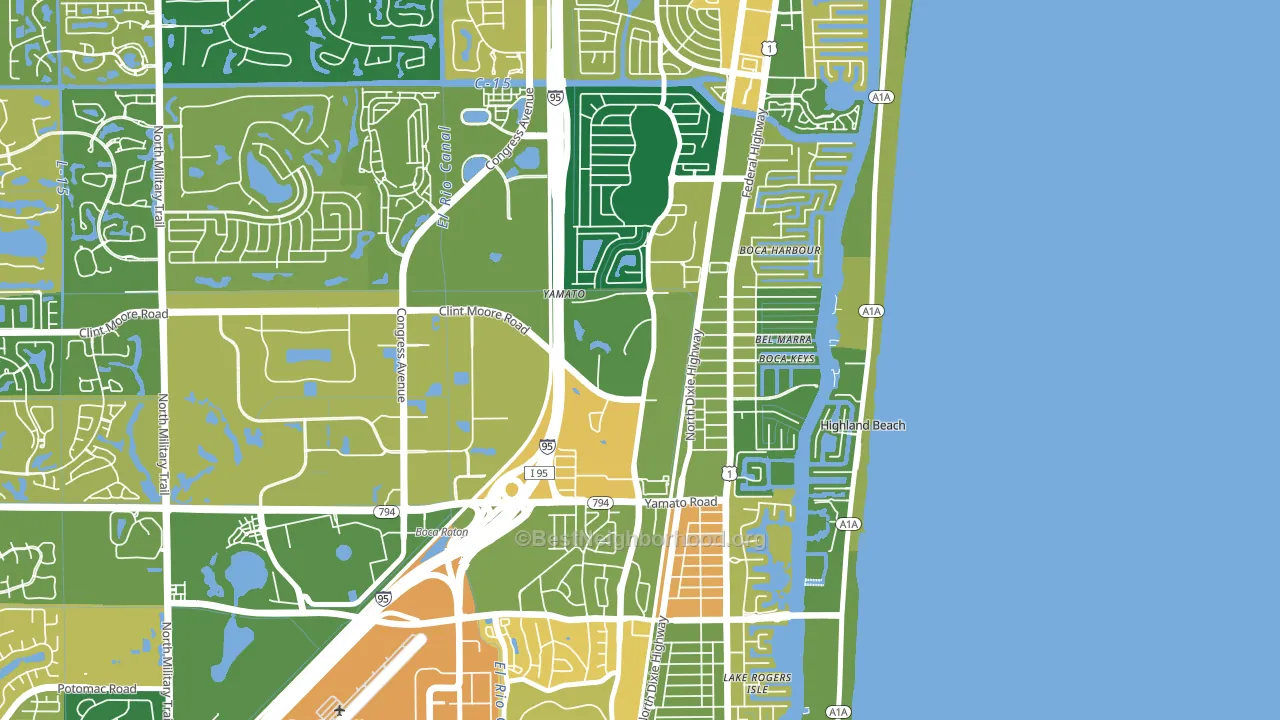
Paved land cover and Republican lean
Places with little paved surface tend to lean Republican; Boca Teeca, Boca Raton, FL sits below the national average on this measure. Paved ground does not change how people vote; it mostly reflects how urban and built-up a place is.
Why turnout in Boca Teeca looks the way it does
Turnout in Boca Teeca sits close to the national pattern. Routine healthcare access, homeownership, education, and food security all land near their national averages here. Learn more about the findings and methodology on the political spectrum map.
Nearby Neighborhoods
- Lake Floresta Park, Boca Raton, FL R+7
- Bramalea, Boca Raton, FL Even
- Century Village West, Boca Raton, FL D+13
- Leisureville, Boynton Beach, FL Even
- Indian Spring, Boynton Beach, FL D+18
- Sandalfoot Cove, Boca Raton, FL Even
- Lyons Tradewinds Park, Coconut Creek, FL D+6
- Boynton Lakes Plaza, Boynton Beach, FL D+6
- Meadows, Boynton Beach, FL D+16
- Turtle Run, Coral Springs, FL D+24
Neighborhoods with Similar Populations
- Downtown Bradenton, Bradenton, FL D+22
- Eastside, Binghamton, NY D+15
- West Osbornsville, Brick, NJ R+32
- Sun Willows, Pasco, WA D+13
- Las Palmas, San Antonio, TX D+35
- West Amityville, East Massapequa, NY D+16
- Confederate Point, Jacksonville, FL D+20
- Canterbury Green, Fort Wayne, IN D+21
- Wasatch Hollow, Salt Lake City, UT D+67
- East Meyer, Kansas City, MO D+80
Sources and methodology
Precinct-level voting records used to fit the model come from Florida Division of Elections, distributed by the Voting and Election Science Team. Demographic inputs come from the U.S. Census Bureau (ACS 5-year estimates and the 2020 Decennial Census). Health and environmental inputs come from the CDC (PLACES and the Environmental Justice Index). Land cover comes from the USGS and EPA. Election-day and lead-up weather come from PRISM 4km daily grids and the NOAA Global Historical Climatology Network. Mail-voting and election-administration patterns come from the MIT Election Lab's Survey of the Performance of American Elections. Block-group crime detail comes from CrimeGrade. Internet data and modeling support provided by ISPreports.org.
Modeling and analysis by the BestNeighborhood data science team. Full methodology and findings: political spectrum map.
Methodology reviewed by the BestNeighborhood data team. Last updated May 2026.