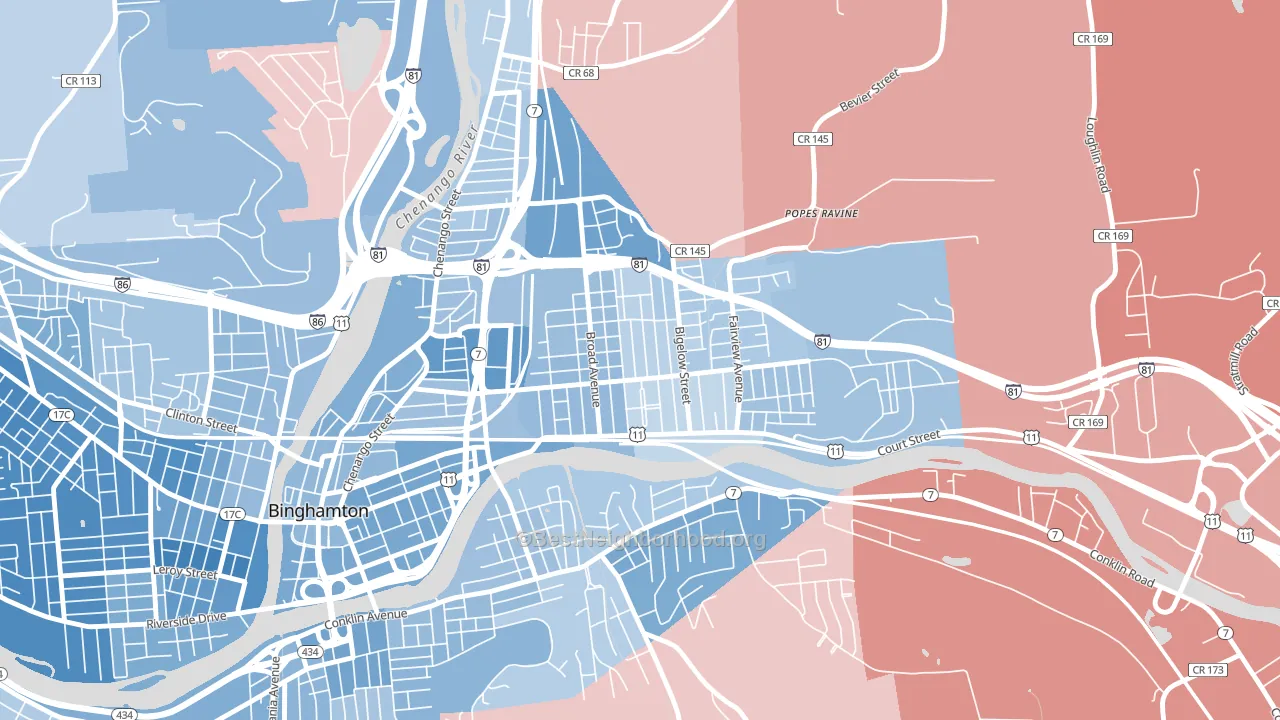
Eastside leans slightly Democratic by roughly 14 points: about 57% of voters vote Democratic and 43% Republican.
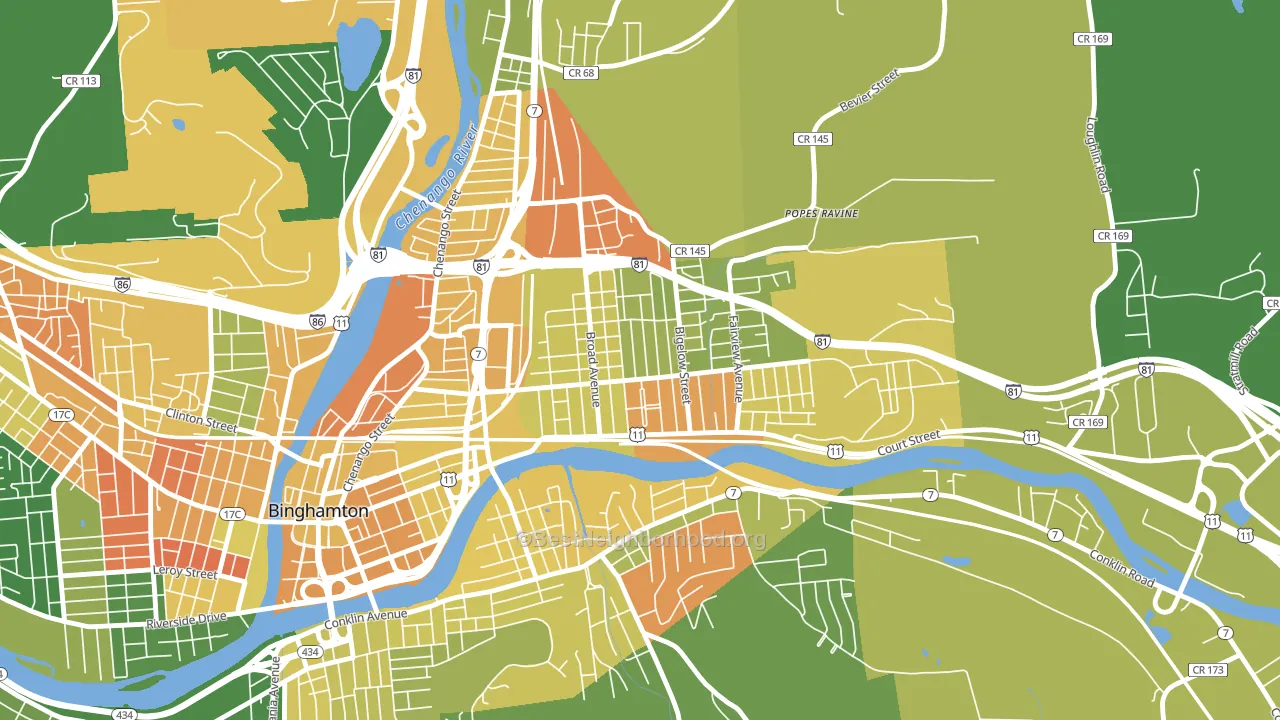
About 52% of adults in Eastside typically vote, below the U.S. average of about 62%. Among adults in Eastside, ~30% vote Democratic, ~22% Republican, and ~48% don't vote. The map below shows estimated turnout by block group.
How Eastside compares
Among neighborhoods within 5 miles, Eastside is the least Democratic-leaning.
Politically, Eastside sits close to the rest of New York.
Politics vary noticeably by block within Eastside. The southwest side is the most Democratic-leaning (D+23) and the northeast side is the least Democratic-leaning (D+9), a spread of about 14 points.
Why Eastside leans the way it does
Density, race composition, education, and family structure all sit close to their national averages in Eastside. The lean here lands roughly where demographic data alone would predict.
Preventive-care access and voter turnout
Places with limited routine preventive-care access tend to turn out at a lower rate; Eastside, Binghamton, NY sits in the bottom quarter nationally on this measure. Dental visits do not drive turnout; the rate reflects income, insurance, and healthcare access, which line up with who votes.
Why turnout in Eastside looks the way it does
Areas with low high-school completion turn out at lower rates. About 84% of adults in Eastside have completed high school, about 6 points below the U.S. average of 90%. Learn more about the findings and methodology on the political spectrum map.
Nearby Neighborhoods
- Downtown Binghamton, Binghamton, NY D+30
- Southside, Binghamton, NY D+26
- Westside, Binghamton, NY D+43
- First Ward, Binghamton, NY D+29
- The Plot, Scranton, PA D+13
- Providence, Scranton, PA D+10
- Green Ridge, Scranton, PA D+17
- West Side, Scranton, PA D+8
- Downtown, Scranton, PA D+28
- The Hill Section, Scranton, PA D+23
Neighborhoods with Similar Populations
- West Osbornsville, Brick, NJ R+32
- Boca Teeca, Boca Raton, FL Even
- Downtown Bradenton, Bradenton, FL D+22
- Las Palmas, San Antonio, TX D+35
- West Amityville, East Massapequa, NY D+16
- Sun Willows, Pasco, WA D+13
- Melrose-Rugby, Roanoke, VA D+81
- Confederate Point, Jacksonville, FL D+20
- East Meyer, Kansas City, MO D+80
- Wasatch Hollow, Salt Lake City, UT D+67
Sources and methodology
Precinct-level voting records used to fit the model come from New York State Board of Elections, distributed by the Voting and Election Science Team. Demographic inputs come from the U.S. Census Bureau (ACS 5-year estimates and the 2020 Decennial Census). Health and environmental inputs come from the CDC (PLACES and the Environmental Justice Index). Land cover comes from the USGS and EPA. Election-day and lead-up weather come from PRISM 4km daily grids and the NOAA Global Historical Climatology Network. Mail-voting and election-administration patterns come from the MIT Election Lab's Survey of the Performance of American Elections. Block-group crime detail comes from CrimeGrade. Internet data and modeling support provided by ISPreports.org.
Modeling and analysis by the BestNeighborhood data science team. Full methodology and findings: political spectrum map.
Methodology reviewed by the BestNeighborhood data team. Last updated May 2026.