Crocker Amazon leans heavily Democratic by roughly 34 points: about 67% of voters vote Democratic and 33% Republican.
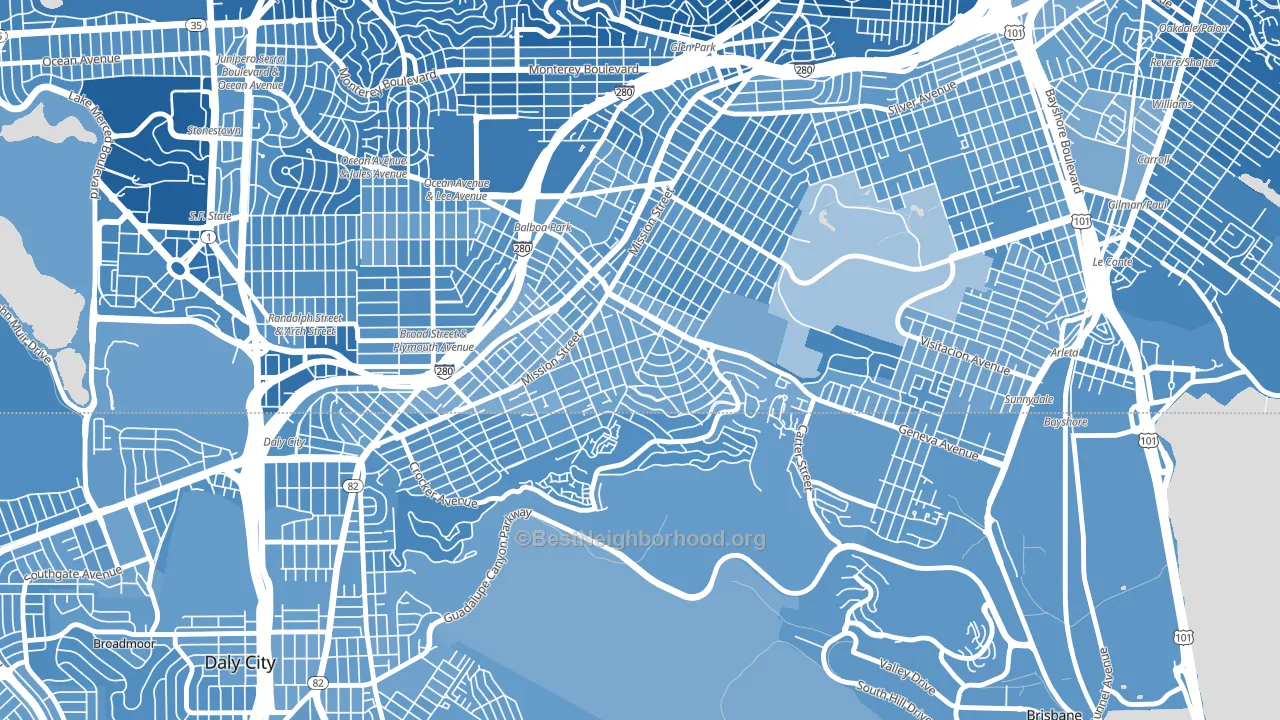
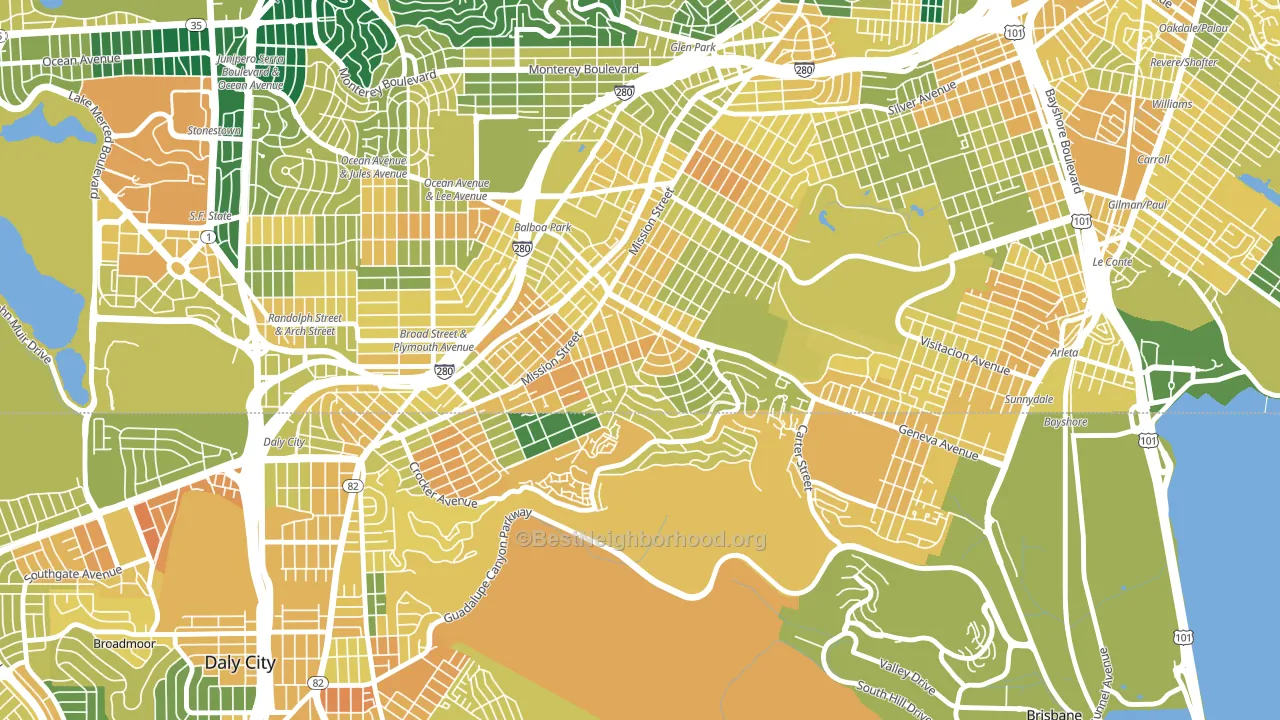
About 51% of adults in Crocker Amazon typically vote, below the U.S. average of about 62%. Among adults in Crocker Amazon, ~34% vote Democratic, ~17% Republican, and ~49% don't vote. The map below shows estimated turnout by block group.
How Crocker Amazon compares
Among neighborhoods within 5 miles, Crocker Amazon is the least Democratic-leaning.
Crocker Amazon runs about 14 points more Democratic than California as a whole.
Why Crocker Amazon leans the way it does
Density, race composition, education, and family structure all sit close to their national averages in Crocker Amazon. The lean here lands roughly where demographic data alone would predict.
Walkability and Democratic lean
Places with a highly walkable street grid tend to lean Democratic; Crocker Amazon, San Francisco, CA sits in the top tenth nationally on this measure. A walkable street grid does not change how people vote; it mostly reflects how urban a place is.
Why turnout in Crocker Amazon looks the way it does
Crowded housing lines up with lower turnout. About 12% of homes in Crocker Amazon have more than one occupant per room, above 94% of neighborhoods. Learn more about the findings and methodology on the political spectrum map.
Nearby Neighborhoods
- Crocker, Daly City, CA D+42
- Outer Mission, San Francisco, CA D+48
- Excelsior, San Francisco, CA D+39
- Ingleside, San Francisco, CA D+50
- Ocean View, San Francisco, CA D+45
- St Marys Park, San Francisco, CA D+53
- Visitacion Valley, San Francisco, CA D+36
- Original Daly City, Daly City, CA D+40
- Glen Park, San Francisco, CA D+79
- Hillside, Daly City, CA D+39
Neighborhoods with Similar Populations
- College Hill, Cincinnati, OH D+61
- McCullough Hills, Henderson, NV D+4
- Southwest Carrollton, Carrollton, TX D+13
- Live Oak, Santa Cruz, CA D+50
- Civic Center, Stockton, CA D+34
- East Central, Salt Lake City, UT D+68
- Nuuanu-Punchbowl, Honolulu, HI D+31
- Audubon, New Orleans, LA D+39
- Great Northwest, San Antonio, TX D+10
- Adams Morgan, Washington, DC D+83
Sources and methodology
Precinct-level voting records used to fit the model come from California Secretary of State, Elections, distributed by the Voting and Election Science Team. Demographic inputs come from the U.S. Census Bureau (ACS 5-year estimates and the 2020 Decennial Census). Health and environmental inputs come from the CDC (PLACES and the Environmental Justice Index). Land cover comes from the USGS and EPA. Election-day and lead-up weather come from PRISM 4km daily grids and the NOAA Global Historical Climatology Network. Mail-voting and election-administration patterns come from the MIT Election Lab's Survey of the Performance of American Elections. Block-group crime detail comes from CrimeGrade. Internet data and modeling support provided by ISPreports.org.
Modeling and analysis by the BestNeighborhood data science team. Full methodology and findings: political spectrum map.
Methodology reviewed by the BestNeighborhood data team. Last updated May 2026.