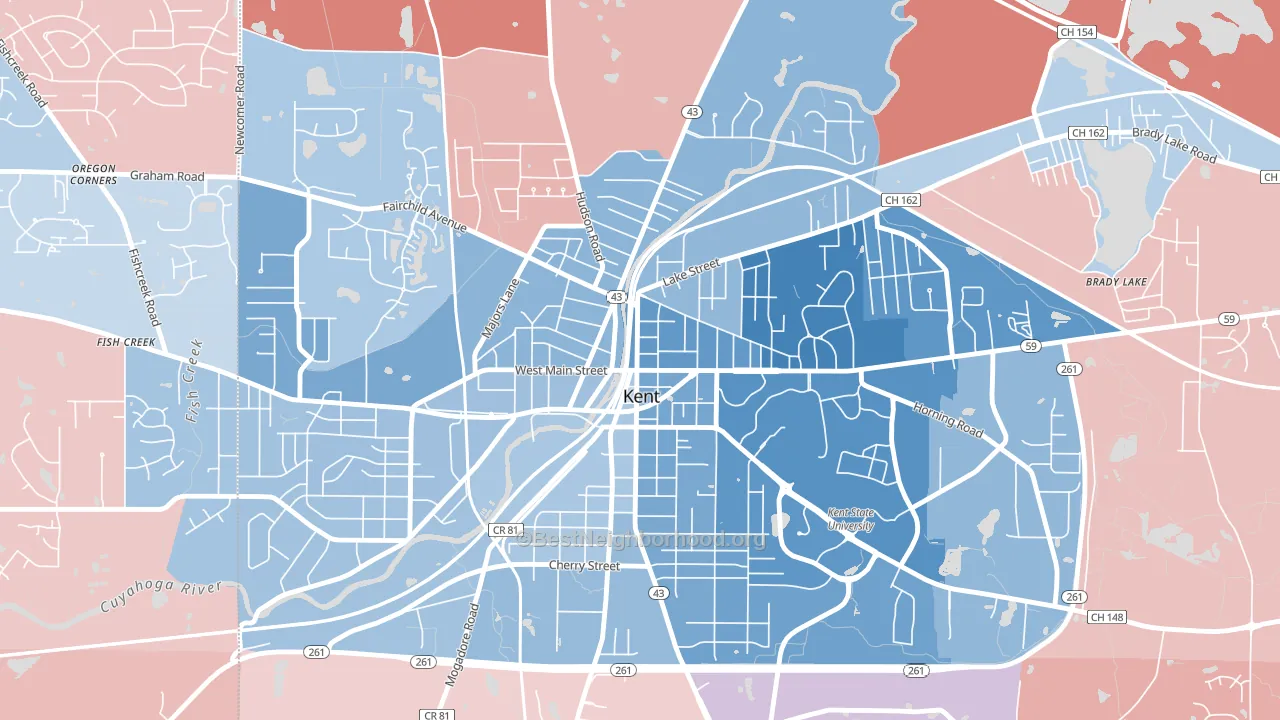
Downtown Kent leans Democratic by roughly 30 points: about 65% of voters vote Democratic and 35% Republican.
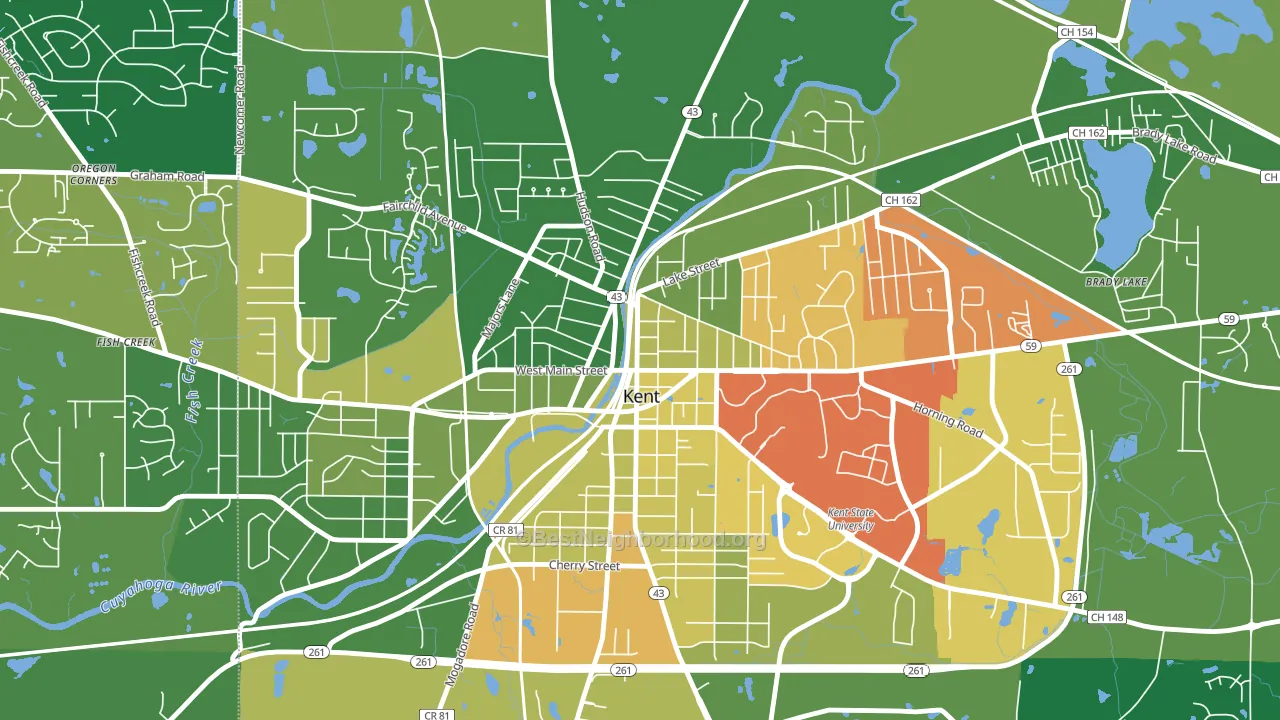
About 71% of adults in Downtown Kent typically vote, above the U.S. average of about 62%. Among adults in Downtown Kent, ~46% vote Democratic, ~25% Republican, and ~29% don't vote. The map below shows estimated turnout by block group.
How Downtown Kent compares
Downtown Kent runs about 40 points more Democratic than Ohio as a whole. Ohio leans Republican overall, while Downtown Kent is one of the few Democratic-leaning pockets.
Politics vary noticeably by block within Downtown Kent. The east side is the most Democratic-leaning (D+43) and the northwest side is the least Democratic-leaning (D+19), a spread of about 24 points.
Why Downtown Kent leans the way it does
This analysis examined 14,881 data points per neighborhood to find what predicts political lean and turnout. The items below are a few correlations that stood out for Downtown Kent, not a ranked or complete list of what matters most.
Downtown Kent votes against the grain of Ohio. Ohio leans Republican overall, while Downtown Kent runs about 40 points more Democratic. A high never-married share predicts Democratic voting, and about 48% of adults in Downtown Kent have never been married, above 79% of neighborhoods.
High-school completion and voter turnout
Places with high-school-completion-heavy adults tend to turn out at a higher rate; Downtown Kent, Kent, OH sits in the top quarter nationally on this measure.
Why turnout in Downtown Kent looks the way it does
Turnout in Downtown Kent sits close to the national pattern. Routine healthcare access, homeownership, education, and food security all land near their national averages here. Learn more about the findings and methodology on the political spectrum map.
Nearby Neighborhoods
- East Village, Cuyahoga Falls, OH D+7
- North Village, Cuyahoga Falls, OH D+7
- West Village, Cuyahoga Falls, OH D+6
- Chapel Hill, Akron, OH D+20
- Goodyear Heights, Akron, OH D+22
- North Hill, Akron, OH D+27
- Ellet, Akron, OH R+4
- Middlebury, Akron, OH D+42
- Elizabeth Park Valley, Akron, OH D+46
- University of Ohio Akron, Akron, OH D+49
Neighborhoods with Similar Populations
- Mabury Park, Santa Ana, CA D+20
- Arlington Heights, Milwaukee, WI D+88
- Howland Hook, Staten Island, NY D+58
- Ghent, Norfolk, VA D+49
- Oakland-Winchell, Kalamazoo, MI D+46
- Hubbell, Pasadena, TX R+5
- Durrs Homeowners, Fort Lauderdale, FL D+80
- South Pointe, San Bernardino, CA D+13
- Tarpon River, Fort Lauderdale, FL D+4
- Ybor City, Tampa, FL D+48
Sources and methodology
Precinct-level voting records used to fit the model come from Ohio Secretary of State, Elections, distributed by the Voting and Election Science Team. Demographic inputs come from the U.S. Census Bureau (ACS 5-year estimates and the 2020 Decennial Census). Health and environmental inputs come from the CDC (PLACES and the Environmental Justice Index). Land cover comes from the USGS and EPA. Election-day and lead-up weather come from PRISM 4km daily grids and the NOAA Global Historical Climatology Network. Mail-voting and election-administration patterns come from the MIT Election Lab's Survey of the Performance of American Elections. Block-group crime detail comes from CrimeGrade. Internet data and modeling support provided by ISPreports.org.
Modeling and analysis by the BestNeighborhood data science team. Full methodology and findings: political spectrum map.
Methodology reviewed by the BestNeighborhood data team. Last updated May 2026.