West Atherton leans heavily Democratic by roughly 44 points: about 72% of voters vote Democratic and 28% Republican.
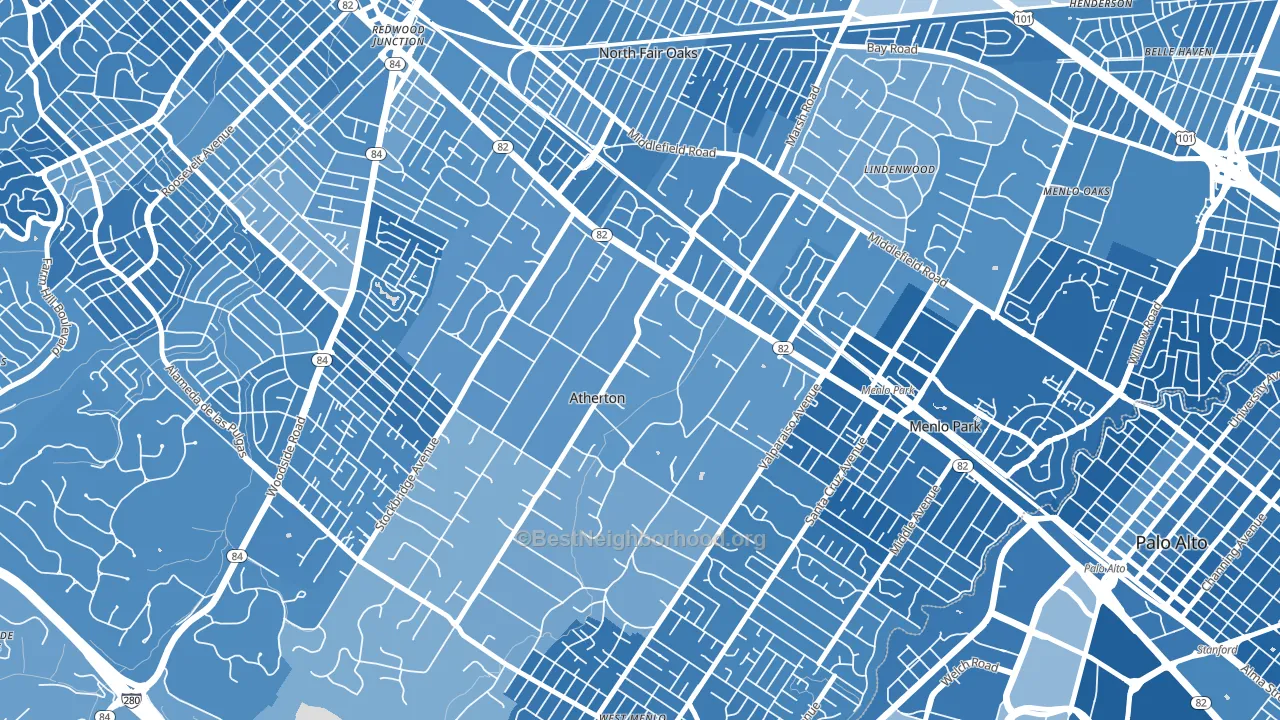
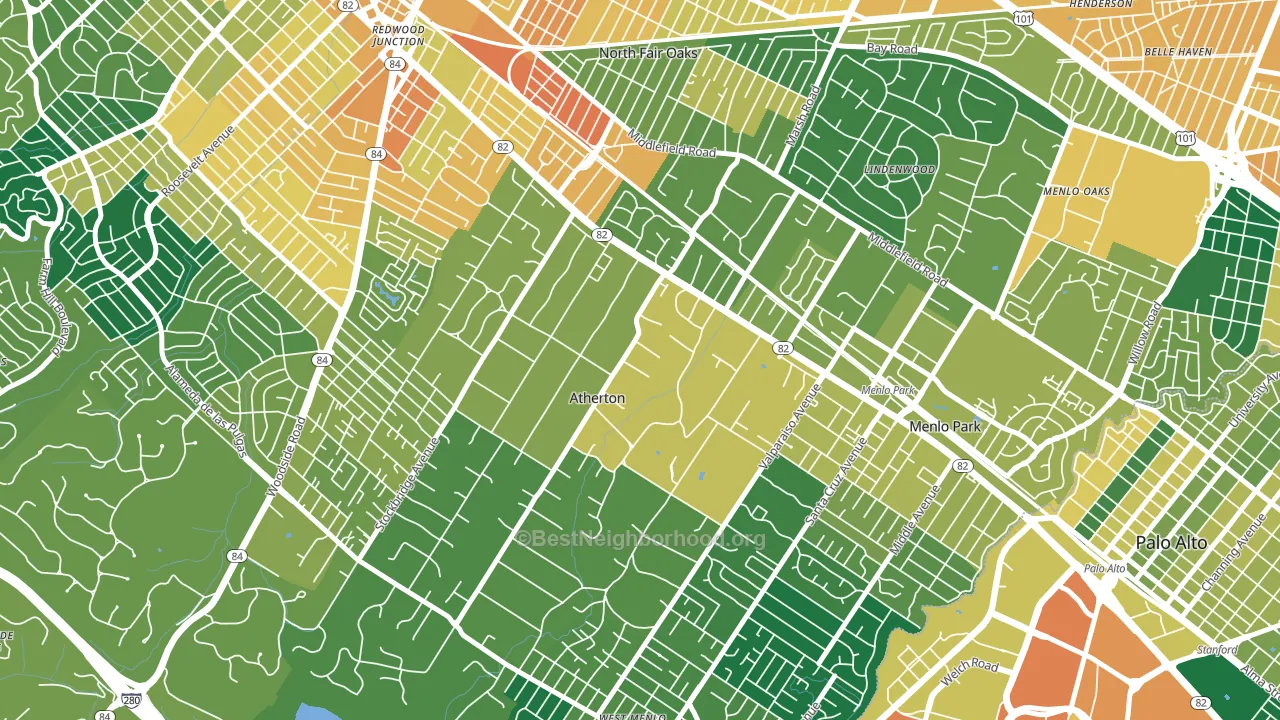
About 68% of adults in West Atherton typically vote, above the U.S. average of about 62%. Among adults in West Atherton, ~49% vote Democratic, ~19% Republican, and ~32% don't vote. The map below shows estimated turnout by block group.
How West Atherton compares
Among neighborhoods within 5 miles, West Atherton leans more Democratic than 2 of 20 neighbors.
West Atherton runs about 23 points more Democratic than California as a whole.
Politics vary noticeably by block within West Atherton. The east side is the most Democratic-leaning (D+63) and the southeast side is the least Democratic-leaning (D+36), a spread of about 26 points.
Why West Atherton leans the way it does
This analysis examined 14,881 data points per neighborhood to find what predicts political lean and turnout. The items below are a few correlations that stood out for West Atherton, not a ranked or complete list of what matters most.
Areas with high college attainment vote Democratic. About 72% of adults in West Atherton hold a bachelor's degree, about 44 points above the U.S. average of 28%.
Developed land and Democratic lean
Places with a heavily developed built environment tend to lean Democratic; West Atherton, Atherton, CA sits above the national average on this measure. Developed land does not change how people vote; it mostly reflects how urban a place is.
Why turnout in West Atherton looks the way it does
Areas with strong routine healthcare access turn out at higher rates. West Atherton is in the top quarter nationally for routine-care measures such as insurance coverage, preventive screenings, and dental visits. The dental-visit rate here is about 72%, about 12 points above the U.S. average of 60%. Learn more about the findings and methodology on the political spectrum map.
Nearby Neighborhoods
- Downtown Menlo Park, Menlo Park, CA D+71
- Fair Oaks, North Fair Oaks, CA D+54
- Redwood Village, Redwood City, CA D+49
- Friendly Acres, Redwood City, CA D+47
- Sharon Heights, Menlo Park, CA D+63
- Staumbaugh Heller, Redwood City, CA D+51
- Downtown North San Jose, Palo Alto, CA D+64
- Roosevelt-San Francisco, Redwood City, CA D+54
- University South, Palo Alto, CA D+66
- Belle Haven, Menlo Park, CA D+50
Neighborhoods with Similar Populations
- Idylwood, Redmond, WA D+51
- Fondren Gardens, Houston, TX D+44
- Mount Pleasant Area, Mount Pleasant, NC R+59
- Norton Commons, Prospect, KY R+4
- Raintree, Kissimmee, FL R+5
- Rothfield, Semmes, AL R+41
- Biscayne Terrace, Jacksonville, FL D+65
- Highland Farms-San Antonio, San Antonio, TX D+36
- Talus, Issaquah, WA D+54
- El Gheko, Tucson, AZ D+29
Sources and methodology
Precinct-level voting records used to fit the model come from California Secretary of State, Elections, distributed by the Voting and Election Science Team. Demographic inputs come from the U.S. Census Bureau (ACS 5-year estimates and the 2020 Decennial Census). Health and environmental inputs come from the CDC (PLACES and the Environmental Justice Index). Land cover comes from the USGS and EPA. Election-day and lead-up weather come from PRISM 4km daily grids and the NOAA Global Historical Climatology Network. Mail-voting and election-administration patterns come from the MIT Election Lab's Survey of the Performance of American Elections. Block-group crime detail comes from CrimeGrade. Internet data and modeling support provided by ISPreports.org.
Modeling and analysis by the BestNeighborhood data science team. Full methodology and findings: political spectrum map.
Methodology reviewed by the BestNeighborhood data team. Last updated May 2026.