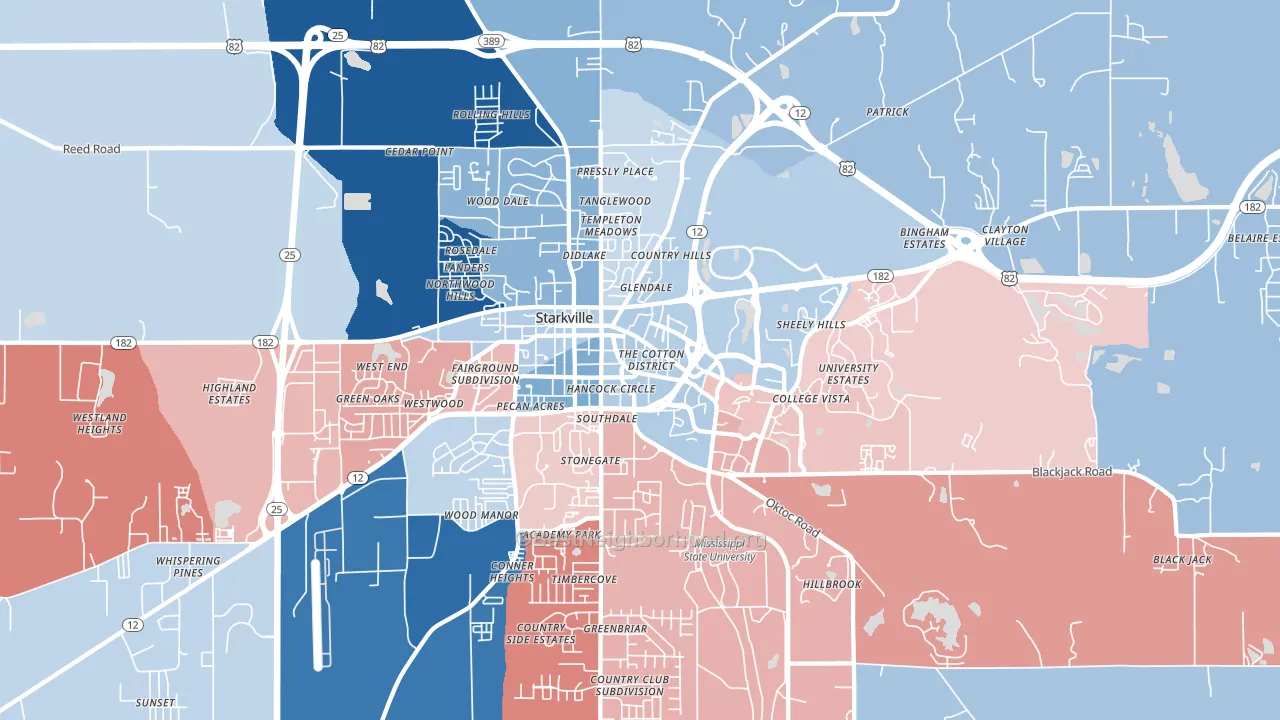
College View is a true toss-up. About 52% of voters here vote Democratic and 48% Republican.
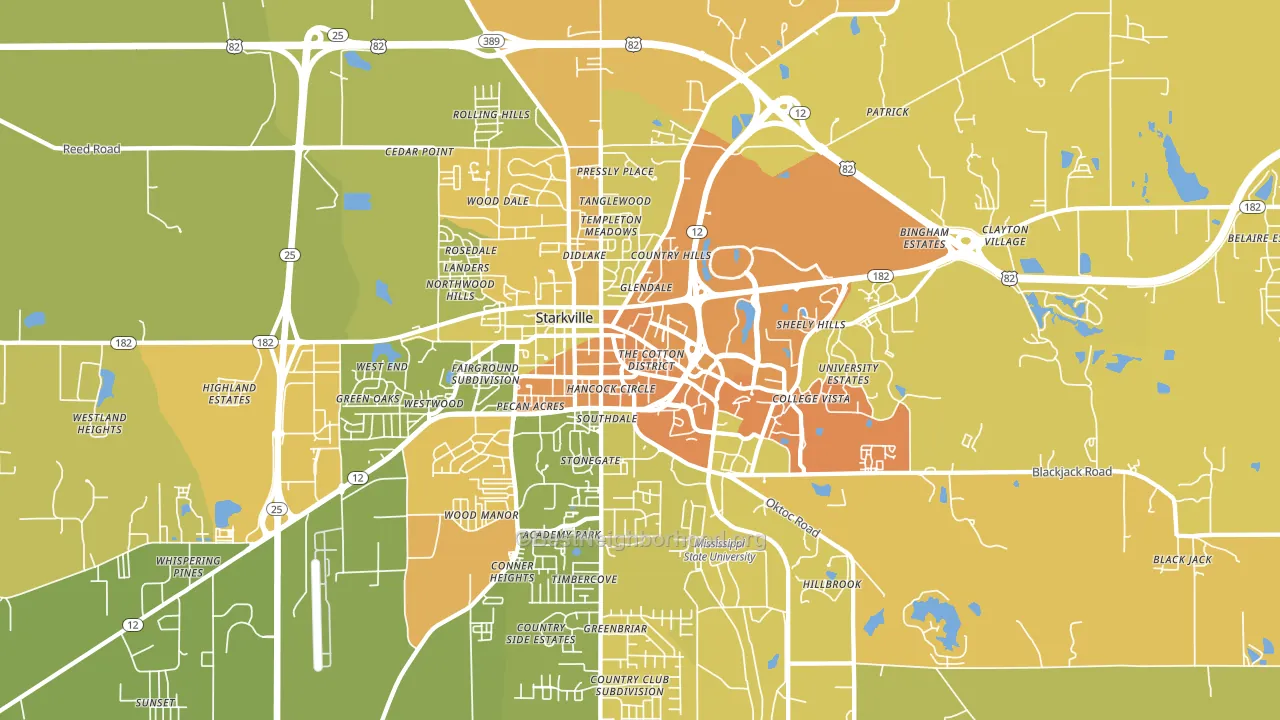
About 40% of adults in College View typically vote, below the U.S. average of about 62%. Among adults in College View, ~21% vote Democratic, ~19% Republican, and ~60% don't vote. The map below shows estimated turnout by block group.
How College View compares
College View runs about 27 points more Democratic than Mississippi as a whole. Mississippi leans Republican overall, while College View is one of the few Democratic-leaning pockets.
Politics vary noticeably by block within College View. The northeast side runs the most Democratic (D+13) and the southwest side runs the most Republican (R+4), a spread of about 17 points.
Why College View leans the way it does
This analysis examined 14,881 data points per neighborhood to find what predicts political lean and turnout. The items below are a few correlations that stood out for College View, not a ranked or complete list of what matters most.
College View votes against the grain of Mississippi. Mississippi leans Republican overall, while College View runs about 27 points more Democratic.
Homeownership and voter turnout
Places with renter-heavy households tend to turn out at a lower rate; College View, Starkville, MS sits in the bottom tenth nationally on this measure.
Why turnout in College View looks the way it does
Renters vote less often than owners. About 78% of households in College View rent, about 53 points above the U.S. average of 25%. Learn more about the findings and methodology on the political spectrum map.
Nearby Neighborhoods
- Audubon Place, Tuscaloosa, AL D+14
- Longbrook Estates, Bessemer, AL D+75
- Northbrook, Jackson, MS D+85
- Belview Heights, Birmingham, AL D+90
- Fondren North Renaissance, Jackson, MS D+32
- Greater Belhaven, Jackson, MS D+34
- Arlington, Birmingham, AL D+90
- Glen Iris, Birmingham, AL D+56
- Queens-Magnolia Terrace, Jackson, MS D+86
- Riverchase Country Club, Hoover, AL R+31
Neighborhoods with Similar Populations
- Landon Branch, Waco, TX R+16
- Crooked River Ranch, Terrebonne, OR R+43
- Johnson Ranch, Roseville, CA R+2
- Grand Park, Jacksonville, FL D+84
- Prairie Hills, Madison, WI D+64
- Wortendyke, Midland Park, NJ R+2
- Woodhaven, Fargo, ND R+13
- Glacier View, Everett, WA D+16
- Eden Isle, Horizon West, FL R+6
- El Paso Lower Valley, El Paso, TX D+26
Sources and methodology
Precinct-level voting records used to fit the model come from Mississippi Secretary of State, Elections, distributed by the Voting and Election Science Team. Demographic inputs come from the U.S. Census Bureau (ACS 5-year estimates and the 2020 Decennial Census). Health and environmental inputs come from the CDC (PLACES and the Environmental Justice Index). Land cover comes from the USGS and EPA. Election-day and lead-up weather come from PRISM 4km daily grids and the NOAA Global Historical Climatology Network. Mail-voting and election-administration patterns come from the MIT Election Lab's Survey of the Performance of American Elections. Block-group crime detail comes from CrimeGrade. Internet data and modeling support provided by ISPreports.org.
Modeling and analysis by the BestNeighborhood data science team. Full methodology and findings: political spectrum map.
Methodology reviewed by the BestNeighborhood data team. Last updated May 2026.