Fordville leans slightly Republican by roughly 8 points: about 46% of voters vote Democratic and 54% Republican.
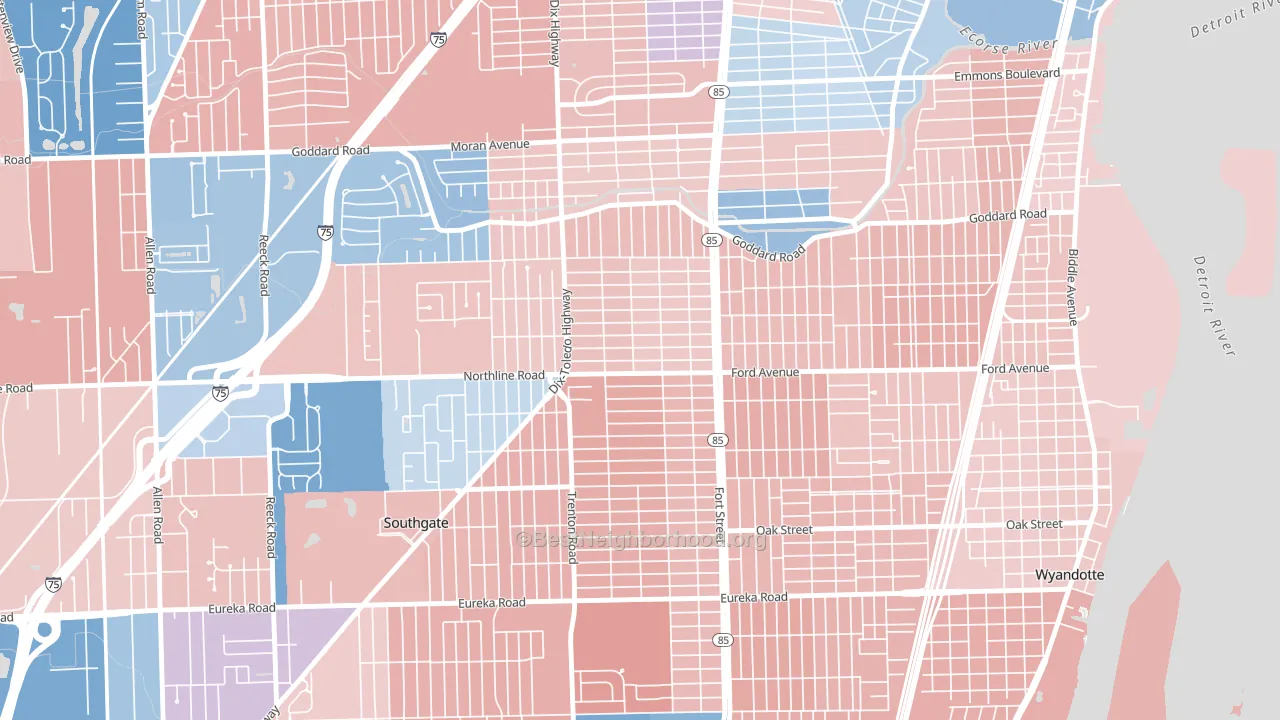
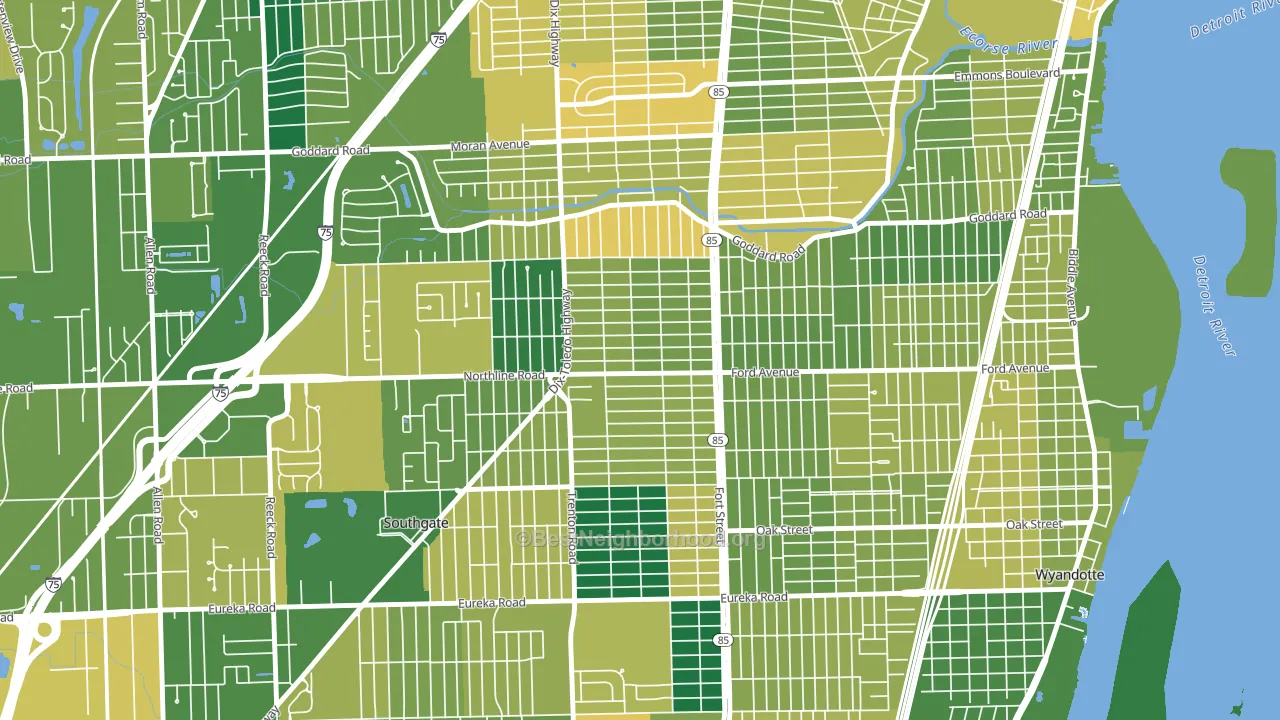
About 73% of adults in Fordville typically vote, above the U.S. average of about 62%. Among adults in Fordville, ~33% vote Democratic, ~39% Republican, and ~28% don't vote. The map below shows estimated turnout by block group.
How Fordville compares
Among neighborhoods within 5 miles, Fordville is the most Republican-leaning.
Fordville runs about 6 points more Republican than Michigan as a whole.
Why Fordville leans the way it does
This analysis examined 14,881 data points per neighborhood to find what predicts political lean and turnout. The items below are a few correlations that stood out for Fordville, not a ranked or complete list of what matters most.
Fordville votes Republican even though it is densely developed (more than 99%, far above the Michigan average of 31%). State and regional patterns outweigh the Democratic lean that density usually predicts here. A high white share with below-average college attainment predicts Republican voting, and Fordville fits that profile on both counts.
Walkability and Republican lean
Places with a low walkability score tend to lean Republican; Fordville, Southgate, MI sits below the national average on this measure. A walkable street grid does not change how people vote; it mostly reflects how urban a place is.
Why turnout in Fordville looks the way it does
Homeowners vote more often than renters. About 87% of households in Fordville own their home, about 12 points above the U.S. average of 75%. Learn more about the findings and methodology on the political spectrum map.
Nearby Neighborhoods
- Mount Carmel, Wyandotte, MI R+7
- Emmons Orchard, Lincoln Park, MI R+3
- Downtown Wyandotte, Wyandotte, MI Even
- Boynton, Detroit, MI D+85
- Snow Woods, Dearborn, MI Even
- Southwestern Outer Drive, Dearborn, MI D+3
- West Downtown Dearborn, Dearborn, MI D+8
- Springwells, Detroit, MI D+29
- East Downtown Dearborn, Dearborn, MI R+20
- Southwest Detroit, Detroit, MI D+28
Neighborhoods with Similar Populations
- Neighborhood Nine, Cambridge, MA D+78
- Vine, Kalamazoo, MI D+51
- Boal, Chula Vista, CA D+23
- Route 66 Historic District, Amarillo, TX R+12
- Milan, New Orleans, LA D+62
- Paloma Lake, Round Rock, TX D+5
- Woburn Street Historic District, Reading, MA D+33
- Pecan Springs Springdale, Austin, TX D+69
- Mooretown and Hollywood Heights, Shreveport, LA D+90
- Hadwen Park, Worcester, MA D+20
Sources and methodology
Precinct-level voting records used to fit the model come from Michigan Department of State, Elections, distributed by the Voting and Election Science Team. Demographic inputs come from the U.S. Census Bureau (ACS 5-year estimates and the 2020 Decennial Census). Health and environmental inputs come from the CDC (PLACES and the Environmental Justice Index). Land cover comes from the USGS and EPA. Election-day and lead-up weather come from PRISM 4km daily grids and the NOAA Global Historical Climatology Network. Mail-voting and election-administration patterns come from the MIT Election Lab's Survey of the Performance of American Elections. Block-group crime detail comes from CrimeGrade. Internet data and modeling support provided by ISPreports.org.
Modeling and analysis by the BestNeighborhood data science team. Full methodology and findings: political spectrum map.
Methodology reviewed by the BestNeighborhood data team. Last updated May 2026.