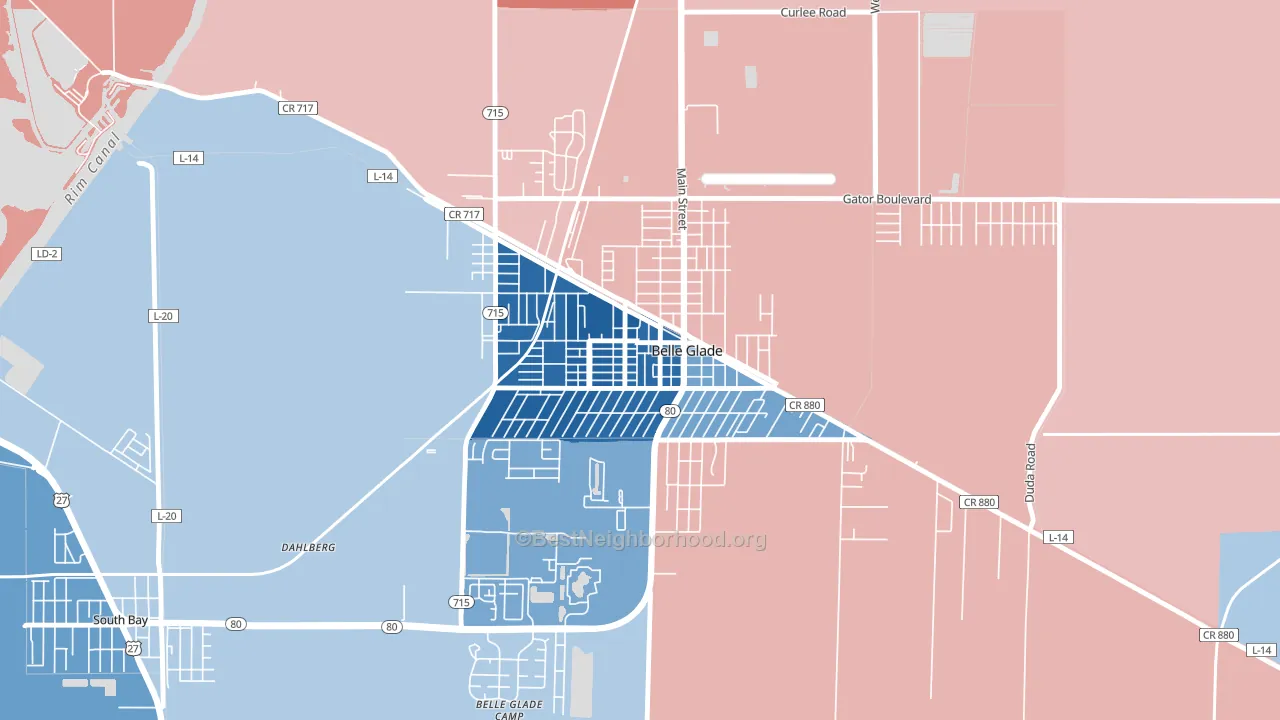
Downtown Belle Glade is a Democratic stronghold. About 87% of voters here vote Democratic and 13% Republican.
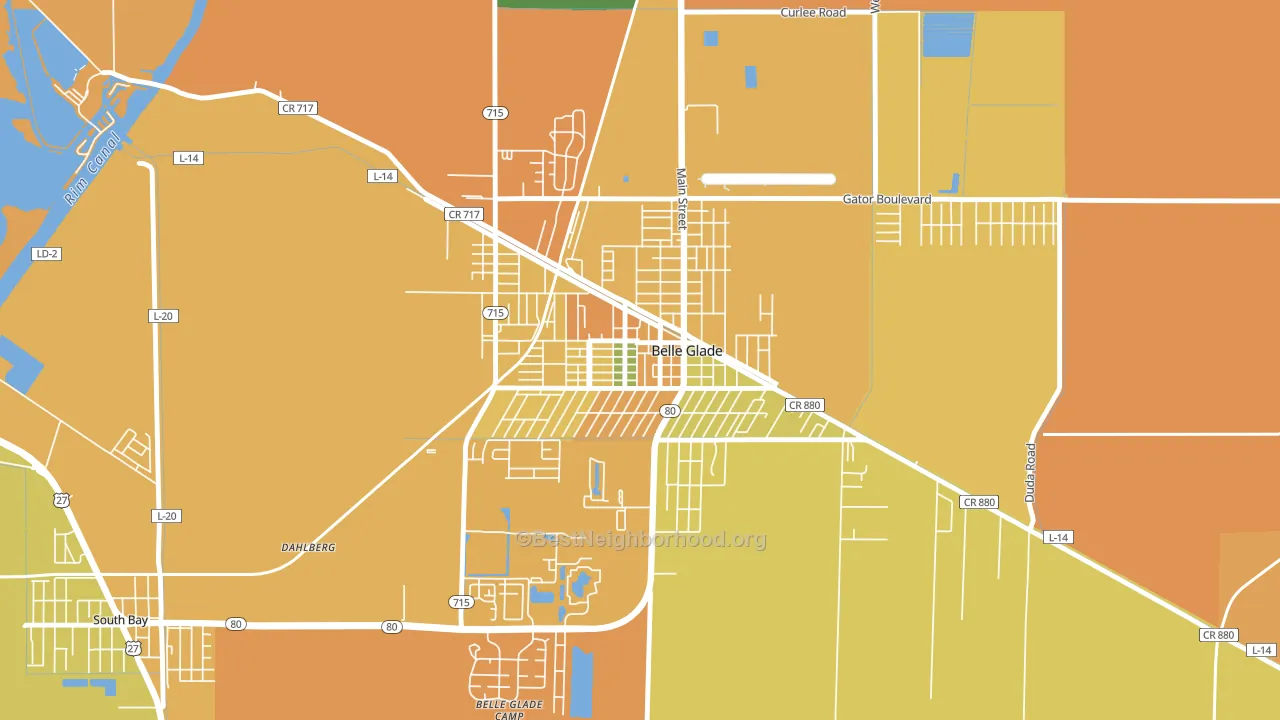
About 45% of adults in Downtown Belle Glade typically vote, below the U.S. average of about 62%. Among adults in Downtown Belle Glade, ~39% vote Democratic, ~6% Republican, and ~55% don't vote. The map below shows estimated turnout by block group.
How Downtown Belle Glade compares
Downtown Belle Glade runs about 86 points more Democratic than Florida as a whole. Florida leans Republican overall, while Downtown Belle Glade is one of the few Democratic-leaning pockets.
Politics vary noticeably by block within Downtown Belle Glade. The north side is the most Democratic-leaning (D+82) and the southeast side is the least Democratic-leaning (D+34), a spread of about 48 points.
Why Downtown Belle Glade leans the way it does
This analysis examined 14,881 data points per neighborhood to find what predicts political lean and turnout. The items below are a few correlations that stood out for Downtown Belle Glade, not a ranked or complete list of what matters most.
Downtown Belle Glade votes against the grain of Florida. Florida leans Republican overall, while Downtown Belle Glade runs about 86 points more Democratic. A high never-married share predicts Democratic voting, and about 59% of adults in Downtown Belle Glade have never been married, above 93% of neighborhoods.
Preventive-care access and voter turnout
Places with limited routine preventive-care access tend to turn out at a lower rate; Downtown Belle Glade, Belle Glade, FL sits in the bottom tenth nationally on this measure. Dental visits do not drive turnout; the rate reflects income, insurance, and healthcare access, which line up with who votes.
Why turnout in Downtown Belle Glade looks the way it does
Areas with limited routine healthcare access turn out at lower rates. Downtown Belle Glade is in the bottom quarter nationally for routine-care measures such as insurance coverage, preventive screenings, and dental visits. The dental-visit rate here is about 38%, about 19 points below the Florida average of 56%. Renters vote less often than owners, and about 89% of households in Downtown Belle Glade rent, compared to around 22% in nearby neighborhoods. Low high-school completion lines up with lower turnout, and about 64% of adults in Downtown Belle Glade have completed high school, below 97% of neighborhoods. Learn more about the findings and methodology on the political spectrum map.
Nearby Neighborhoods
- Sugar Pond Manor of Wellington, Wellington, FL R+6
- South Shore of Wellington, Wellington, FL R+3
- Olympia, Wellington, FL Even
- Pineapple Park, West Palm Beach, FL R+10
- Water Catchment Area, West Palm Beach, FL D+14
- Smith Dairy West, Lake Worth, FL D+3
- Lake Charleston, Lake Worth, FL R+4
- Century Village, West Palm Beach, FL D+11
- Palm Club Village, West Palm Beach, FL D+24
- Indian Spring, Boynton Beach, FL D+18
Neighborhoods with Similar Populations
- North End, Phillipsburg, NJ D+6
- Borchert Field, Milwaukee, WI D+88
- Downtown Madison Heights, Madison Heights, MI D+8
- Essex, Chicago, IL D+82
- Mission Bend South, Mission Bend, TX D+21
- Livingston-McNaughten, Columbus, OH D+58
- The Boulevards, Canton, OH D+21
- Woodlawn Court, Hattiesburg, MS D+54
- Isle of Palms, Jacksonville Beach, FL R+39
- Kabrich Crescent, Blacksburg, VA D+37
Sources and methodology
Precinct-level voting records used to fit the model come from Florida Division of Elections, distributed by the Voting and Election Science Team. Demographic inputs come from the U.S. Census Bureau (ACS 5-year estimates and the 2020 Decennial Census). Health and environmental inputs come from the CDC (PLACES and the Environmental Justice Index). Land cover comes from the USGS and EPA. Election-day and lead-up weather come from PRISM 4km daily grids and the NOAA Global Historical Climatology Network. Mail-voting and election-administration patterns come from the MIT Election Lab's Survey of the Performance of American Elections. Block-group crime detail comes from CrimeGrade. Internet data and modeling support provided by ISPreports.org.
Modeling and analysis by the BestNeighborhood data science team. Full methodology and findings: political spectrum map.
Methodology reviewed by the BestNeighborhood data team. Last updated May 2026.