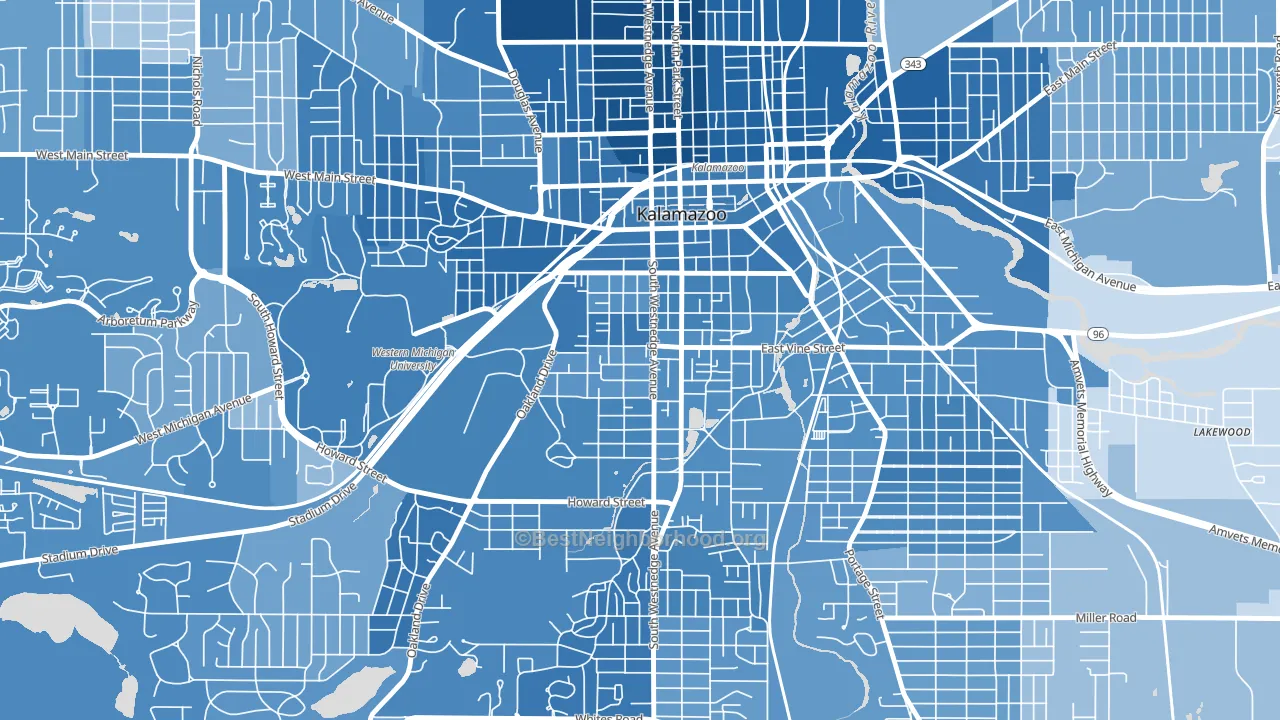
Vine is a Democratic stronghold. About 76% of voters here vote Democratic and 24% Republican.
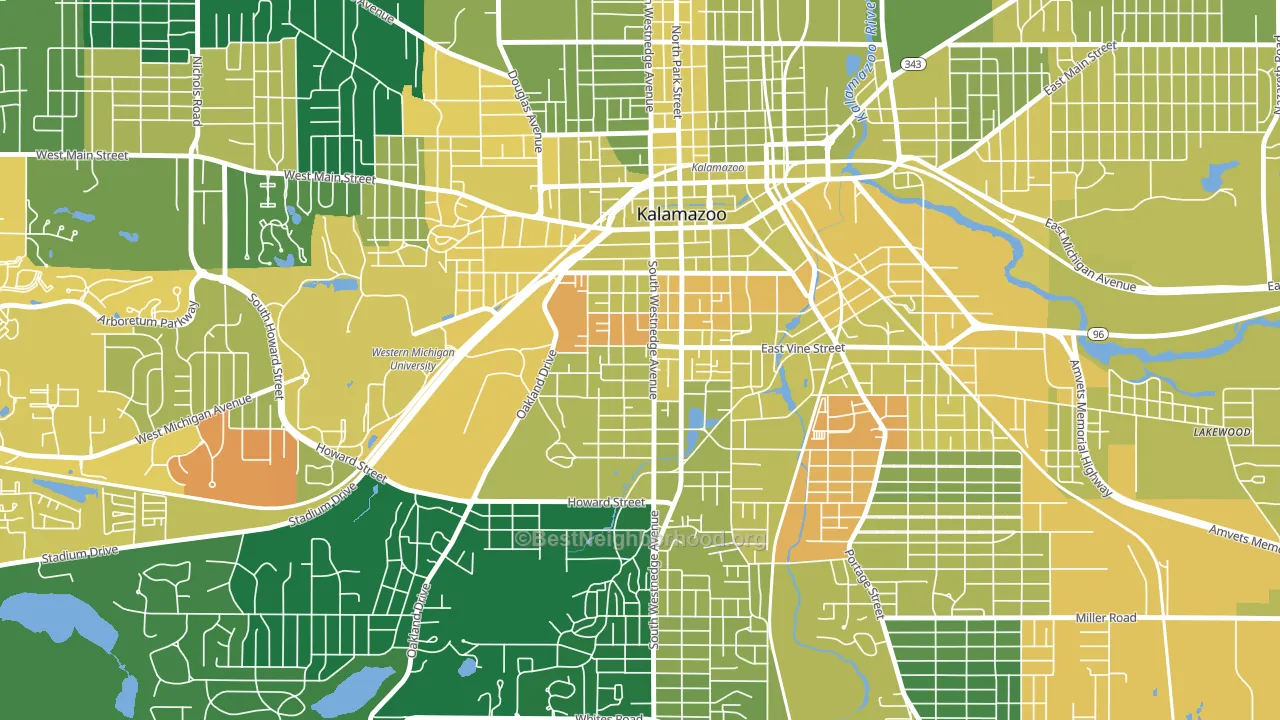
About 61% of adults in Vine typically vote, near the U.S. average of about 62%. Among adults in Vine, ~46% vote Democratic, ~15% Republican, and ~39% don't vote. The map below shows estimated turnout by block group.
How Vine compares
Among neighborhoods within 5 miles, Vine leans more Democratic than 8 of 10 neighbors.
Vine runs about 53 points more Democratic than Michigan as a whole. Michigan is roughly evenly split, and Vine sits clearly on the Democratic side.
Politics vary noticeably by block within Vine. The northeast side is the most Democratic-leaning (D+59) and the southeast side is the least Democratic-leaning (D+44), a spread of about 15 points.
Why Vine leans the way it does
This analysis examined 14,881 data points per neighborhood to find what predicts political lean and turnout. The items below are a few correlations that stood out for Vine, not a ranked or complete list of what matters most.
Vine votes against the grain of Michigan. Michigan is roughly evenly split, while Vine runs about 53 points more Democratic. A high never-married share predicts Democratic voting, and about 65% of adults in Vine have never been married, above 96% of neighborhoods.
Homeownership and voter turnout
Places with renter-heavy households tend to turn out at a lower rate; Vine, Kalamazoo, MI sits in the bottom tenth nationally on this measure.
Why turnout in Vine looks the way it does
Renters vote less often than owners. About 78% of households in Vine rent, about 53 points above the U.S. average of 25%. High-crime urban areas turn out at lower rates, and Vine sits in the top 15% on a violent-crime measure. Learn more about the findings and methodology on the political spectrum map.
Nearby Neighborhoods
- Western Michigan University-KRPH, Kalamazoo, MI D+51
- Westnedge Hill, Kalamazoo, MI D+50
- Edison, Kalamazoo, MI D+43
- Northside, Kalamazoo, MI D+79
- Oakland-Winchell, Kalamazoo, MI D+46
- Knollwood, Kalamazoo, MI D+42
- South Westnedge, Kalamazoo, MI D+38
- Arcadia, Kalamazoo, MI D+43
- Milwood, Kalamazoo, MI D+28
- Burke Acres, Kalamazoo, MI D+29
Neighborhoods with Similar Populations
- Neighborhood Nine, Cambridge, MA D+78
- Fordville, Southgate, MI R+8
- Route 66 Historic District, Amarillo, TX R+12
- Milan, New Orleans, LA D+62
- Boal, Chula Vista, CA D+23
- Paloma Lake, Round Rock, TX D+5
- Woburn Street Historic District, Reading, MA D+33
- Pecan Springs Springdale, Austin, TX D+69
- Belle Valley, Erie, PA R+4
- Mooretown and Hollywood Heights, Shreveport, LA D+90
Sources and methodology
Precinct-level voting records used to fit the model come from Michigan Department of State, Elections, distributed by the Voting and Election Science Team. Demographic inputs come from the U.S. Census Bureau (ACS 5-year estimates and the 2020 Decennial Census). Health and environmental inputs come from the CDC (PLACES and the Environmental Justice Index). Land cover comes from the USGS and EPA. Election-day and lead-up weather come from PRISM 4km daily grids and the NOAA Global Historical Climatology Network. Mail-voting and election-administration patterns come from the MIT Election Lab's Survey of the Performance of American Elections. Block-group crime detail comes from CrimeGrade. Internet data and modeling support provided by ISPreports.org.
Modeling and analysis by the BestNeighborhood data science team. Full methodology and findings: political spectrum map.
Methodology reviewed by the BestNeighborhood data team. Last updated May 2026.