Greenpoint is a Democratic stronghold. About 82% of voters here vote Democratic and 18% Republican.
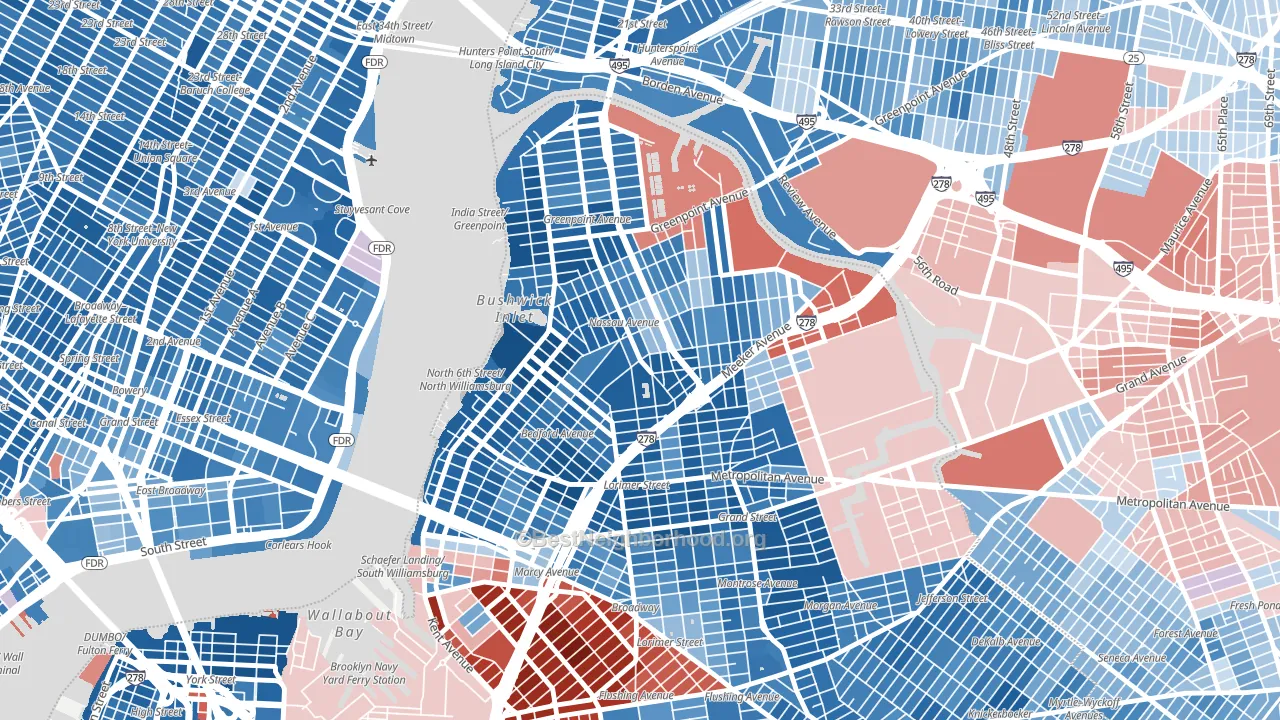
About 60% of adults in Greenpoint typically vote, near the U.S. average of about 62%. Among adults in Greenpoint, ~49% vote Democratic, ~11% Republican, and ~40% don't vote. The map below shows estimated turnout by block group.
How Greenpoint compares
Among neighborhoods within 5 miles, Greenpoint leans more Democratic than 39 of 60 neighbors.
Greenpoint runs about 52 points more Democratic than New York as a whole.
Politics vary noticeably by block within Greenpoint. The southwest side is the most Democratic-leaning (D+74) and the northeast side is the least Democratic-leaning (D+47), a spread of about 27 points.
Why Greenpoint leans the way it does
This analysis examined 14,881 data points per neighborhood to find what predicts political lean and turnout. The items below are a few correlations that stood out for Greenpoint, not a ranked or complete list of what matters most.
Areas with high college attainment vote Democratic. About 70% of adults in Greenpoint hold a bachelor's degree, about 42 points above the U.S. average of 28%. A high never-married share predicts Democratic voting, and about 52% of adults in Greenpoint have never been married, above 84% of neighborhoods.
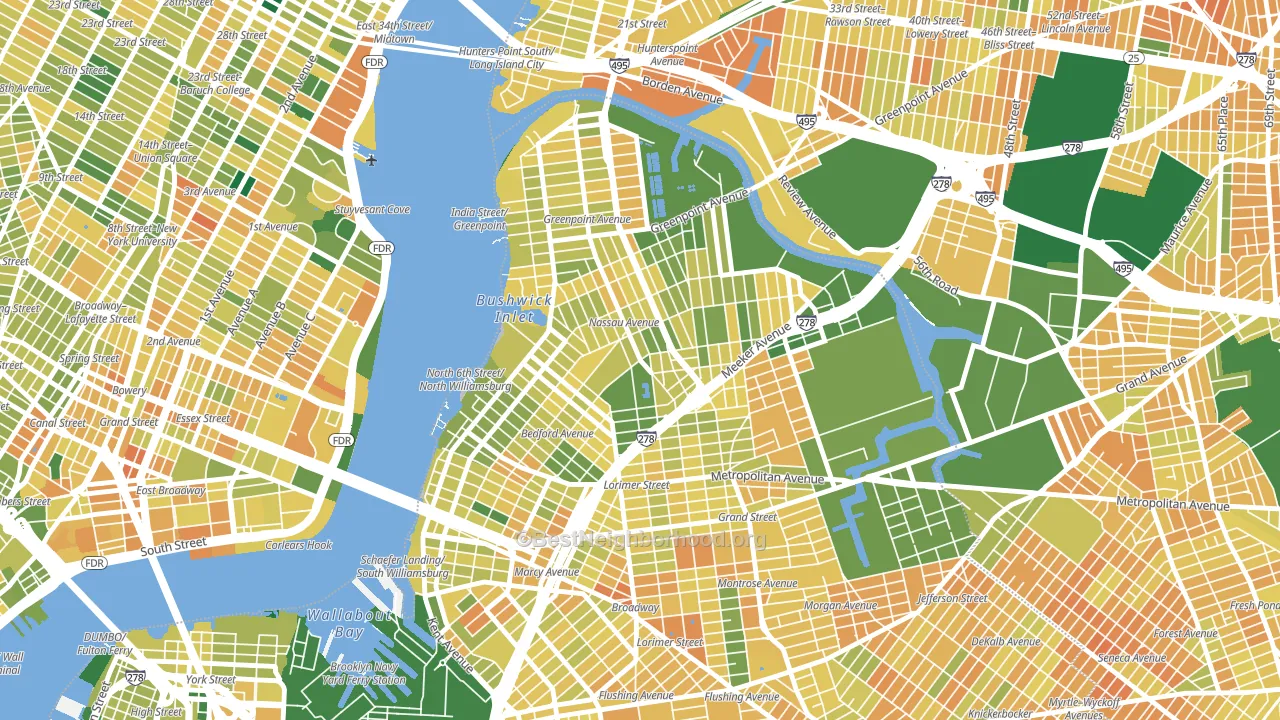
Walkability and Democratic lean
Places with a highly walkable street grid tend to lean Democratic; Greenpoint, Brooklyn, NY sits in the top tenth nationally on this measure. A walkable street grid does not change how people vote; it mostly reflects how urban a place is.
Why turnout in Greenpoint looks the way it does
Renters vote less often than owners. About 80% of households in Greenpoint rent, about 55 points above the U.S. average of 25%. Learn more about the findings and methodology on the political spectrum map.
Nearby Neighborhoods
- Williamsburg, Brooklyn, NY D+16
- East Village, Manhattan, NY D+65
- Long Island City, Queens, NY D+58
- Gramercy, Manhattan, NY D+65
- Kips Bay, Manhattan, NY D+62
- Lower East Side, Manhattan, NY D+47
- Murray Hill, Manhattan, NY D+58
- Clinton Hill, Brooklyn, NY D+69
- Little Italy, Manhattan, NY D+58
- Dumbo, Brooklyn, NY D+76
Neighborhoods with Similar Populations
- St Albans, Queens, NY D+78
- West Omaha, Omaha, NE D+3
- Edgewater, Chicago, IL D+71
- Western Hills Fort Worth, Fort Worth, TX D+7
- El Sereno, Los Angeles, CA D+43
- East Colorado Springs, Colorado Springs, CO D+19
- Downtown San Francisco, San Francisco, CA D+56
- Valley Oak, Stockton, CA D+12
- Southeast Colorado Springs, Colorado Springs, CO D+12
- Country Club, Bronx, NY D+66
Sources and methodology
Precinct-level voting records used to fit the model come from New York State Board of Elections, distributed by the Voting and Election Science Team. Demographic inputs come from the U.S. Census Bureau (ACS 5-year estimates and the 2020 Decennial Census). Health and environmental inputs come from the CDC (PLACES and the Environmental Justice Index). Land cover comes from the USGS and EPA. Election-day and lead-up weather come from PRISM 4km daily grids and the NOAA Global Historical Climatology Network. Mail-voting and election-administration patterns come from the MIT Election Lab's Survey of the Performance of American Elections. Block-group crime detail comes from CrimeGrade. Internet data and modeling support provided by ISPreports.org.
Modeling and analysis by the BestNeighborhood data science team. Full methodology and findings: political spectrum map.
Methodology reviewed by the BestNeighborhood data team. Last updated May 2026.