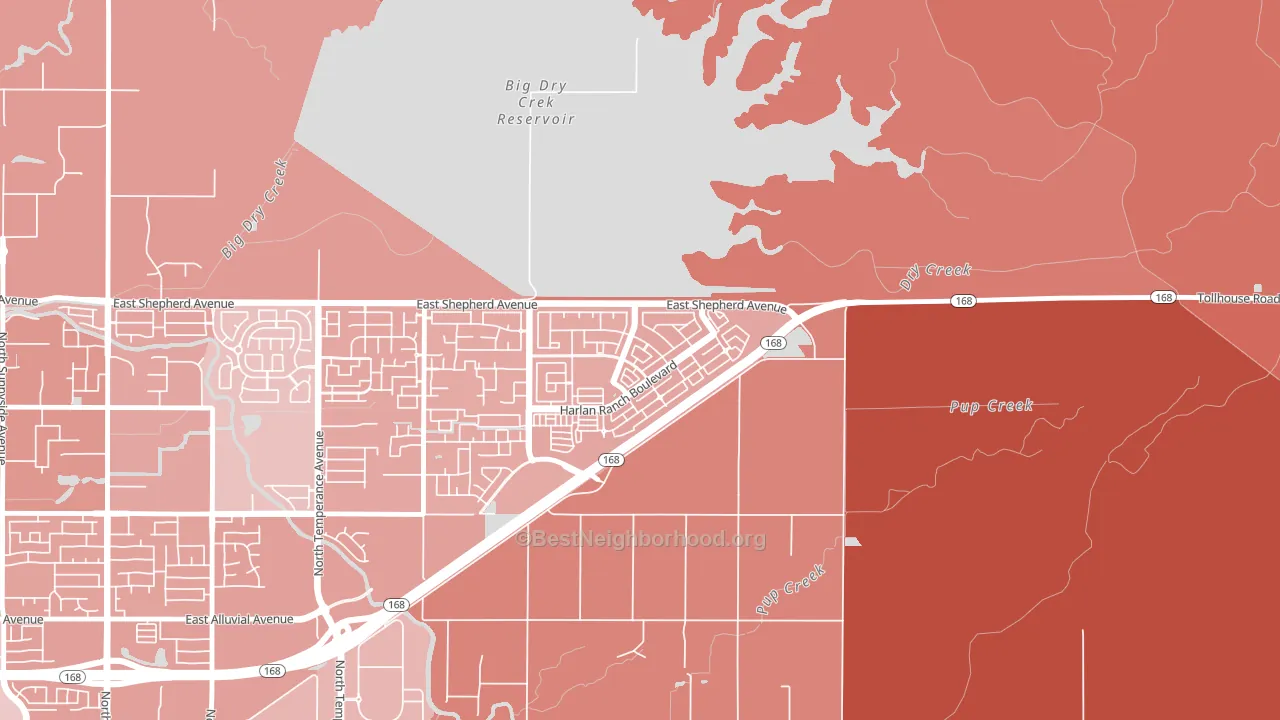
Harlan Ranch leans Republican by roughly 16 points: about 42% of voters vote Democratic and 58% Republican.
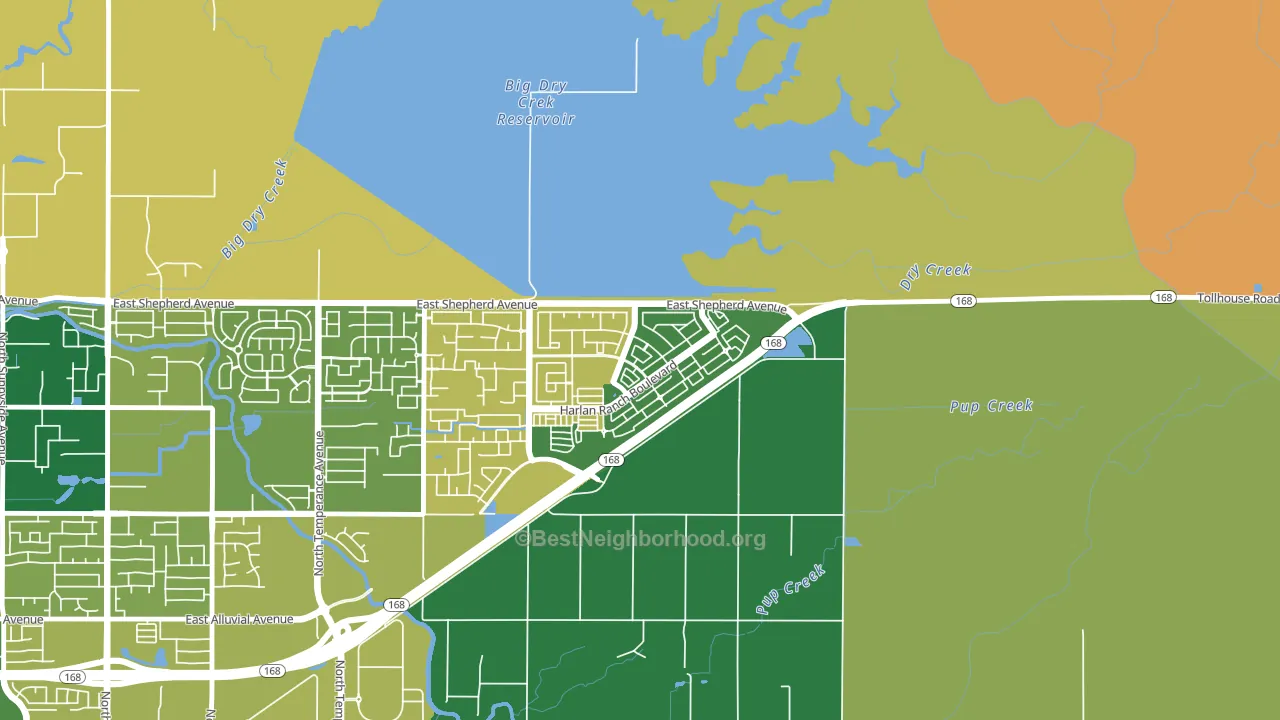
About 77% of adults in Harlan Ranch typically vote, above the U.S. average of about 62%. Among adults in Harlan Ranch, ~32% vote Democratic, ~45% Republican, and ~23% don't vote. The map below shows estimated turnout by block group.
How Harlan Ranch compares
Harlan Ranch runs about 37 points more Republican than California as a whole. California leans Democratic overall, while Harlan Ranch is one of the few Republican-leaning pockets.
Why Harlan Ranch leans the way it does
This analysis examined 14,881 data points per neighborhood to find what predicts political lean and turnout. The items below are a few correlations that stood out for Harlan Ranch, not a ranked or complete list of what matters most.
Car-dependent areas vote Republican. About 90% of residents in Harlan Ranch drive to work alone, about 16 points above the U.S. average of 74%. Harlan Ranch runs against the grain of California, a Republican-leaning pocket in a Democratic-leaning state.
Park access and Republican lean
Places with low park coverage tend to lean Republican; Harlan Ranch, Clovis, CA sits in the bottom quarter nationally on this measure. Park access does not change how people vote; it tends to track denser, higher-income areas.
Why turnout in Harlan Ranch looks the way it does
Areas with strong routine healthcare access turn out at higher rates. Harlan Ranch is in the top quarter nationally for routine-care measures such as insurance coverage, preventive screenings, and dental visits. The dental-visit rate here is about 72%, about 12 points above the U.S. average of 60%. Learn more about the findings and methodology on the political spectrum map.
Nearby Neighborhoods
- Woodward Park, Fresno, CA R+7
- North Growth Area, Fresno, CA R+28
- Southeast Growth Area, Fresno, CA R+34
- Hoover, Fresno, CA D+12
- McLane, Fresno, CA D+10
- Roosevelt, Fresno, CA D+18
- Fresno-High, Fresno, CA D+23
- Bullard, Fresno, CA D+4
- Central, Fresno, CA D+30
- Edison, Fresno, CA D+37
Neighborhoods with Similar Populations
- Shingle Creek, Minneapolis, MN D+47
- Monterey, Jacksonville, FL D+15
- Morristown Historic District, Morristown, NJ D+27
- Northridge, Orem, UT R+31
- North Main Historic District, Mount Vernon, OH R+36
- Colonial Avenue Area, Roanoke, VA D+20
- Roosevelt-Toledo, Toledo, OH D+89
- Mosswood, Oakland, CA D+82
- Summit Ridge at West Meadows, Dakota Ridge, CO D+15
- Rock Spring, Arlington, VA D+43
Sources and methodology
Precinct-level voting records used to fit the model come from California Secretary of State, Elections, distributed by the Voting and Election Science Team. Demographic inputs come from the U.S. Census Bureau (ACS 5-year estimates and the 2020 Decennial Census). Health and environmental inputs come from the CDC (PLACES and the Environmental Justice Index). Land cover comes from the USGS and EPA. Election-day and lead-up weather come from PRISM 4km daily grids and the NOAA Global Historical Climatology Network. Mail-voting and election-administration patterns come from the MIT Election Lab's Survey of the Performance of American Elections. Block-group crime detail comes from CrimeGrade. Internet data and modeling support provided by ISPreports.org.
Modeling and analysis by the BestNeighborhood data science team. Full methodology and findings: political spectrum map.
Methodology reviewed by the BestNeighborhood data team. Last updated May 2026.