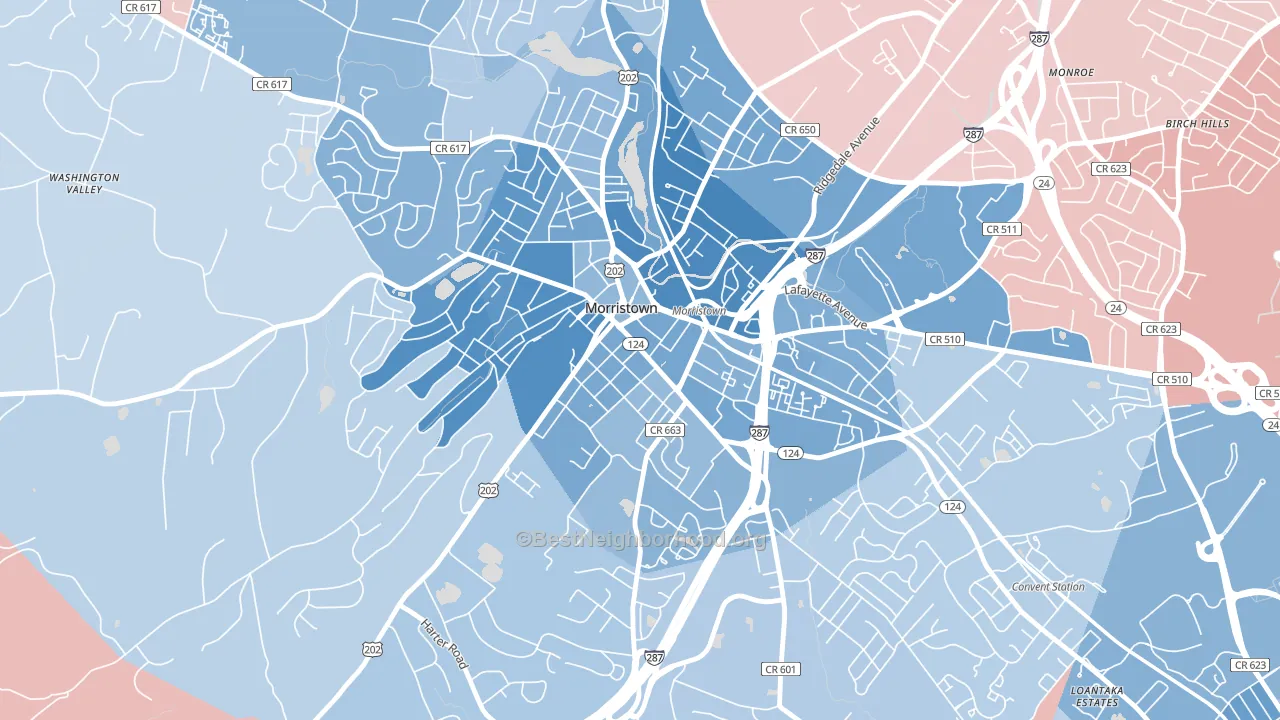
Morristown Historic District leans Democratic by roughly 26 points: about 63% of voters vote Democratic and 37% Republican.
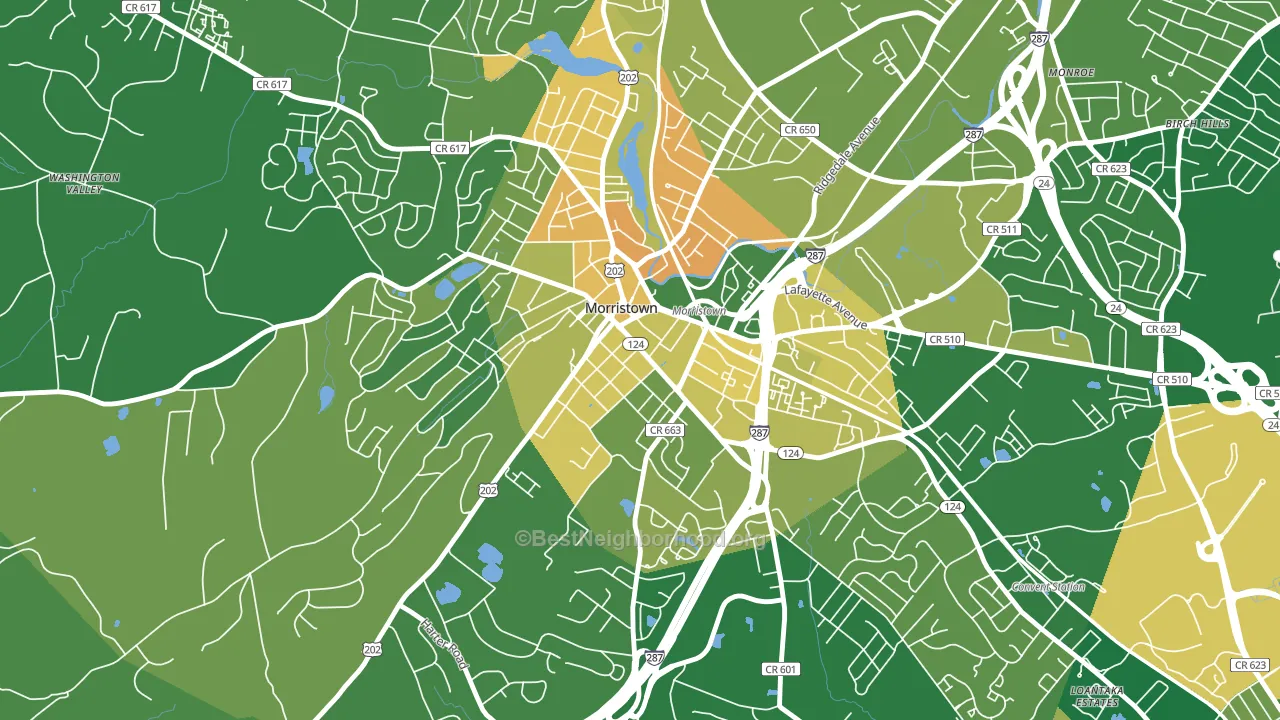
About 55% of adults in Morristown Historic District typically vote, below the U.S. average of about 62%. Among adults in Morristown Historic District, ~35% vote Democratic, ~20% Republican, and ~45% don't vote. The map below shows estimated turnout by block group.
How Morristown Historic District compares
Morristown Historic District runs about 21 points more Democratic than New Jersey as a whole.
Why Morristown Historic District leans the way it does
This analysis examined 14,881 data points per neighborhood to find what predicts political lean and turnout. The items below are a few correlations that stood out for Morristown Historic District, not a ranked or complete list of what matters most.
Areas with high college attainment vote Democratic. About 75% of adults in Morristown Historic District hold a bachelor's degree, about 47 points above the U.S. average of 28%. A high never-married share predicts Democratic voting, and about 59% of adults in Morristown Historic District have never been married, above 92% of neighborhoods.
Population density and Democratic lean
Places with high population density tend to lean Democratic; Morristown Historic District, Morristown, NJ sits in the top tenth nationally on this measure.
Why turnout in Morristown Historic District looks the way it does
Renters vote less often than owners. About 72% of households in Morristown Historic District rent, about 47 points above the U.S. average of 25%. Strong routine healthcare access lines up with higher turnout, and Morristown Historic District sits in the top quarter on routine-care measures. Learn more about the findings and methodology on the political spectrum map.
Nearby Neighborhoods
- Overlook, Summit, NJ D+27
- Hutton Park, West Orange, NJ D+61
- Academy Heights, Orange, NJ D+76
- Washington Park Historic District, North Plainfield, NJ D+25
- Crescent Area Historic District, Plainfield, NJ D+43
- Lower Vailsburg, Newark, NJ D+72
- Van Wyck Brooks Historic District, Plainfield, NJ D+58
- Upper Vailsburg, Newark, NJ D+80
- Fairmuont, Newark, NJ D+73
- Upper Clinton Hill, Newark, NJ D+80
Neighborhoods with Similar Populations
- Harlan Ranch, Clovis, CA R+17
- Monterey, Jacksonville, FL D+15
- Shingle Creek, Minneapolis, MN D+47
- Roosevelt-Toledo, Toledo, OH D+89
- Northridge, Orem, UT R+31
- Mosswood, Oakland, CA D+82
- North Main Historic District, Mount Vernon, OH R+36
- Colonial Avenue Area, Roanoke, VA D+20
- Rock Spring, Arlington, VA D+43
- San Antonio Creekside, San Antonio, TX D+11
Sources and methodology
Precinct-level voting records used to fit the model come from New Jersey Division of Elections, distributed by the Voting and Election Science Team. Demographic inputs come from the U.S. Census Bureau (ACS 5-year estimates and the 2020 Decennial Census). Health and environmental inputs come from the CDC (PLACES and the Environmental Justice Index). Land cover comes from the USGS and EPA. Election-day and lead-up weather come from PRISM 4km daily grids and the NOAA Global Historical Climatology Network. Mail-voting and election-administration patterns come from the MIT Election Lab's Survey of the Performance of American Elections. Block-group crime detail comes from CrimeGrade. Internet data and modeling support provided by ISPreports.org.
Modeling and analysis by the BestNeighborhood data science team. Full methodology and findings: political spectrum map.
Methodology reviewed by the BestNeighborhood data team. Last updated May 2026.