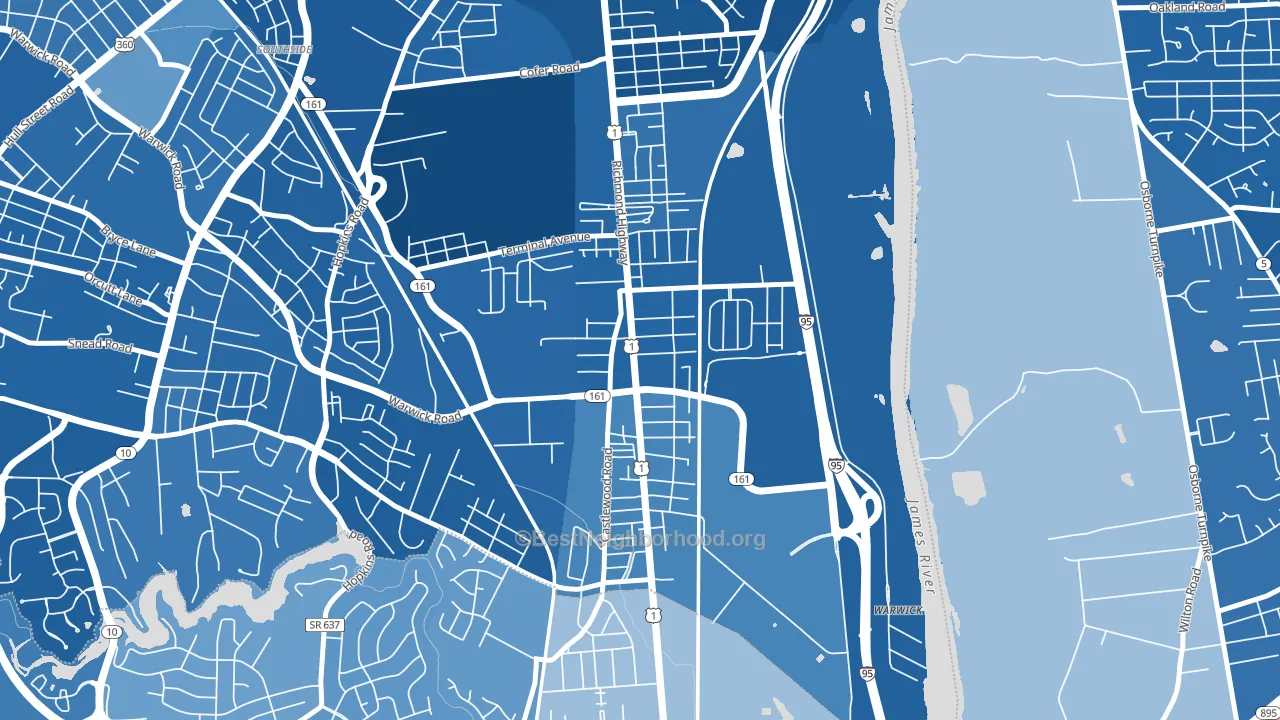
Jeff Davis is a Democratic stronghold. About 79% of voters here vote Democratic and 21% Republican.
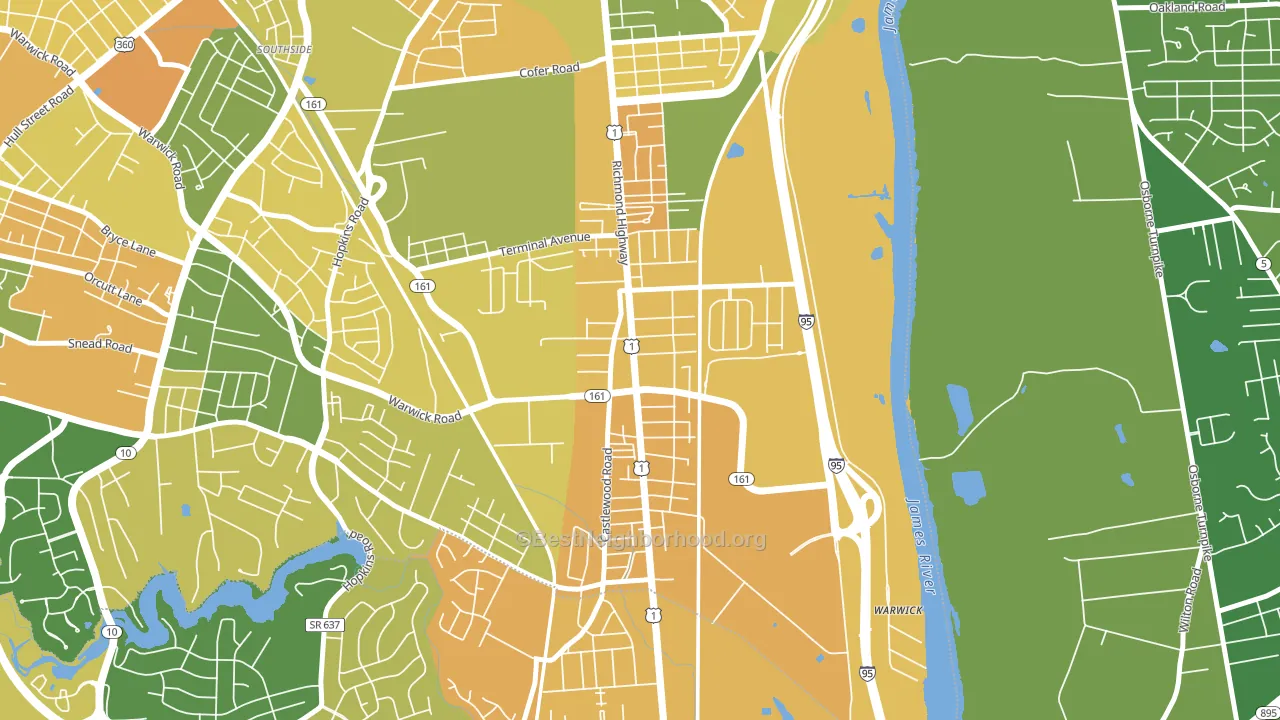
About 41% of adults in Jeff Davis typically vote, below the U.S. average of about 62%. Among adults in Jeff Davis, ~32% vote Democratic, ~9% Republican, and ~59% don't vote. The map below shows estimated turnout by block group.
How Jeff Davis compares
Among neighborhoods within 5 miles, Jeff Davis leans more Democratic than 2 of 10 neighbors.
Jeff Davis runs about 53 points more Democratic than Virginia as a whole.
Politics vary noticeably by block within Jeff Davis. The northwest side is the most Democratic-leaning (D+72) and the southwest side is the least Democratic-leaning (D+45), a spread of about 28 points.
Why Jeff Davis leans the way it does
This analysis examined 14,881 data points per neighborhood to find what predicts political lean and turnout. The items below are a few correlations that stood out for Jeff Davis, not a ranked or complete list of what matters most.
Areas with many never-married adults vote Democratic. About 55% of adults in Jeff Davis have never been married, about 26 points above the U.S. average of 29%.
Preventive-care access and voter turnout
Places with limited routine preventive-care access tend to turn out at a lower rate; Jeff Davis, Richmond, VA sits in the bottom quarter nationally on this measure. Dental visits do not drive turnout; the rate reflects income, insurance, and healthcare access, which line up with who votes.
Why turnout in Jeff Davis looks the way it does
Areas with limited routine healthcare access turn out at lower rates. Jeff Davis is in the bottom quarter nationally for routine-care measures such as insurance coverage, preventive screenings, and dental visits. The dental-visit rate here is about 46%, about 18 points below the Virginia average of 64%. Renters vote less often than owners, and about 65% of households in Jeff Davis rent, about 40 points above the U.S. average of 25%. High food insecurity lines up with lower turnout, and about 36% of adults in Jeff Davis report food insecurity, above 90% of neighborhoods. Learn more about the findings and methodology on the political spectrum map.
Nearby Neighborhoods
- Bellemeade, Richmond, VA D+82
- Southwood, Richmond, VA D+37
- Swansboro, Richmond, VA D+78
- Reedy Creek, Richmond, VA D+70
- Old Town Manchester, Richmond, VA D+64
- Fulton, Montrose Heights, VA D+77
- Shockoe Bottom, Richmond, VA D+65
- Church Hill, Richmond, VA D+74
- Monroe Ward, Richmond, VA D+56
- Jahnke, Richmond, VA D+74
Neighborhoods with Similar Populations
- Long Branch Creek, Arlington, VA D+59
- Wachter's, Bismarck, ND R+18
- Kingsley, Buffalo, NY D+84
- Carver, Waco, TX D+60
- University North, Fort Collins, CO D+59
- Mesa Junction, Pueblo, CO D+27
- Ghent Square, Norfolk, VA D+39
- East Westwood, Cincinnati, OH D+80
- Westchester, Charlotte, NC D+72
- Tampa International Airport Area, Tampa, FL R+4
Sources and methodology
Precinct-level voting records used to fit the model come from Virginia Department of Elections, distributed by the Voting and Election Science Team. Demographic inputs come from the U.S. Census Bureau (ACS 5-year estimates and the 2020 Decennial Census). Health and environmental inputs come from the CDC (PLACES and the Environmental Justice Index). Land cover comes from the USGS and EPA. Election-day and lead-up weather come from PRISM 4km daily grids and the NOAA Global Historical Climatology Network. Mail-voting and election-administration patterns come from the MIT Election Lab's Survey of the Performance of American Elections. Block-group crime detail comes from CrimeGrade. Internet data and modeling support provided by ISPreports.org.
Modeling and analysis by the BestNeighborhood data science team. Full methodology and findings: political spectrum map.
Methodology reviewed by the BestNeighborhood data team. Last updated May 2026.