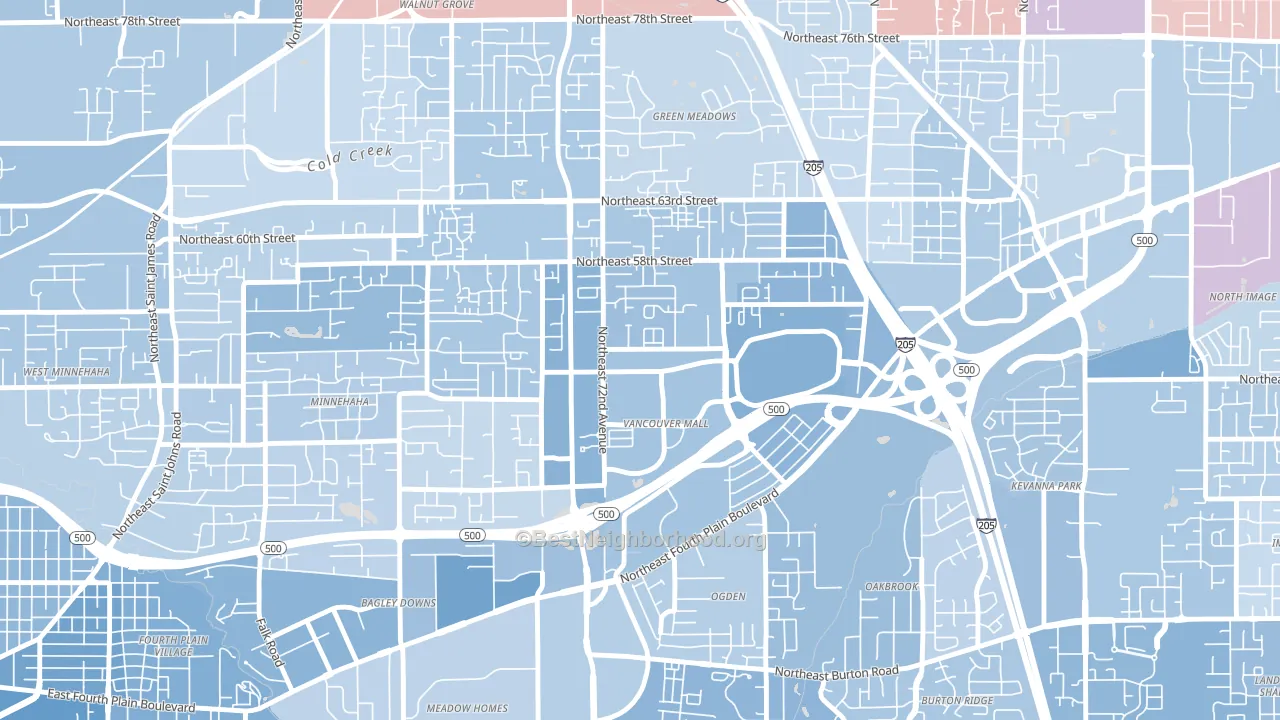
Van Mall leans Democratic by roughly 24 points: about 62% of voters vote Democratic and 38% Republican.
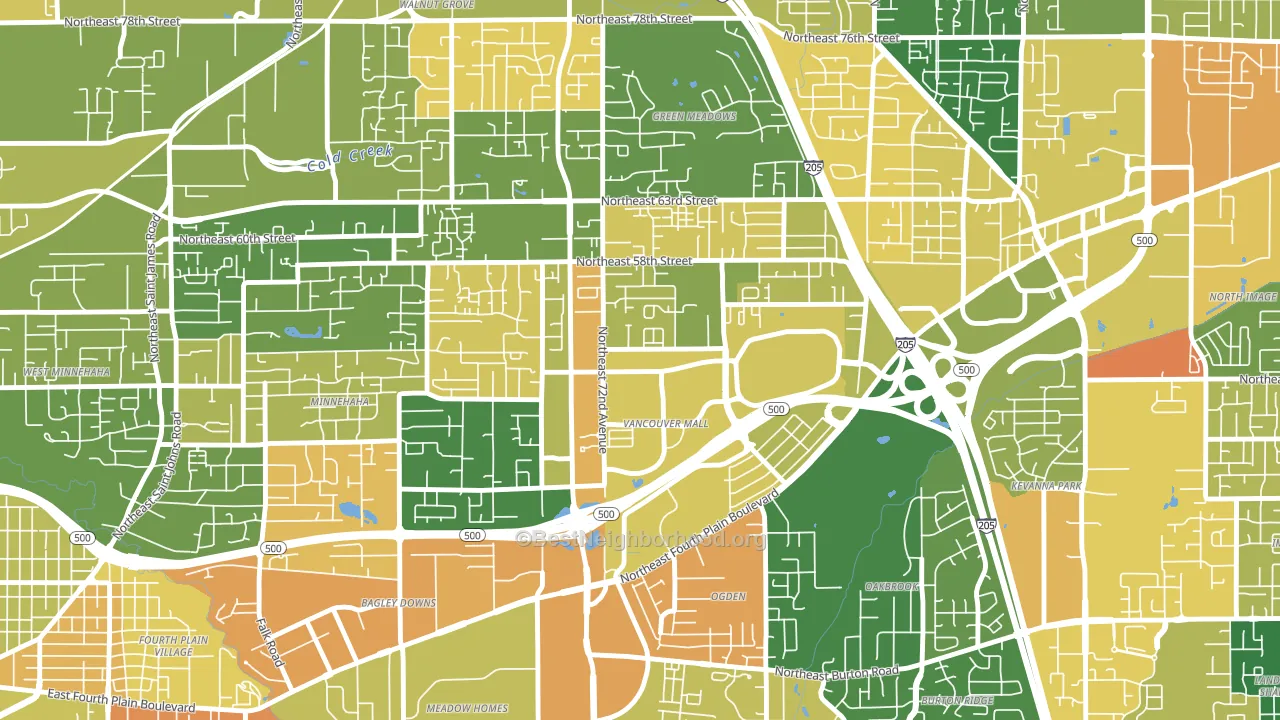
About 58% of adults in Van Mall typically vote, near the U.S. average of about 62%. Among adults in Van Mall, ~36% vote Democratic, ~22% Republican, and ~42% don't vote. The map below shows estimated turnout by block group.
How Van Mall compares
Among neighborhoods within 5 miles, Van Mall leans more Democratic than 19 of 24 neighbors.
Van Mall runs about 5 points more Democratic than Washington as a whole.
Politics vary noticeably by block within Van Mall. The west side is the most Democratic-leaning (D+26) and the south side is the least Democratic-leaning (D+14), a spread of about 13 points.
Why Van Mall leans the way it does
This analysis examined 14,881 data points per neighborhood to find what predicts political lean and turnout. The items below are a few correlations that stood out for Van Mall, not a ranked or complete list of what matters most.
Dense areas vote Democratic. More than 99% of residents in Van Mall live in densely developed areas, about 64 points above the U.S. average of 36%.
Developed land and Democratic lean
Places with a heavily developed built environment tend to lean Democratic; Van Mall, Vancouver, WA sits in the top quarter nationally on this measure. Developed land does not change how people vote; it mostly reflects how urban a place is.
Why turnout in Van Mall looks the way it does
Renters vote less often than owners. About 71% of households in Van Mall rent, about 46 points above the U.S. average of 25%. Learn more about the findings and methodology on the political spectrum map.
Nearby Neighborhoods
- Ogden, Vancouver, WA D+20
- Oakbrook, Vancouver, WA D+13
- Bagley Downs, Vancouver, WA D+20
- Kevanna Park, Vancouver, WA D+13
- Hamey Heights, Vancouver, WA D+32
- Image, Vancouver, WA D+4
- North Image, Vancouver, WA D+6
- Marrion, Vancouver, WA D+15
- Vancouver Heights, Vancouver, WA D+19
- West Minnehaha, Vancouver, WA D+18
Neighborhoods with Similar Populations
- Downtown Pasadena, Pasadena, TX D+6
- Twin Lakes, Federal Way, WA D+28
- Village East, Aurora, CO D+31
- City Center West, Philadelphia, PA D+70
- Vista, Boise, ID D+18
- Robla, Sacramento, CA D+21
- South Side, Wilmington, NC D+57
- Highland Garden, Hollywood, FL D+37
- Silver Terrace, San Francisco, CA D+36
- Little Italy, Manhattan, NY D+58
Sources and methodology
Precinct-level voting records used to fit the model come from Washington Secretary of State, Elections, distributed by the Voting and Election Science Team. Demographic inputs come from the U.S. Census Bureau (ACS 5-year estimates and the 2020 Decennial Census). Health and environmental inputs come from the CDC (PLACES and the Environmental Justice Index). Land cover comes from the USGS and EPA. Election-day and lead-up weather come from PRISM 4km daily grids and the NOAA Global Historical Climatology Network. Mail-voting and election-administration patterns come from the MIT Election Lab's Survey of the Performance of American Elections. Block-group crime detail comes from CrimeGrade. Internet data and modeling support provided by ISPreports.org.
Modeling and analysis by the BestNeighborhood data science team. Full methodology and findings: political spectrum map.
Methodology reviewed by the BestNeighborhood data team. Last updated May 2026.