Little Italy leans heavily Democratic by roughly 40 points: about 70% of voters vote Democratic and 30% Republican.
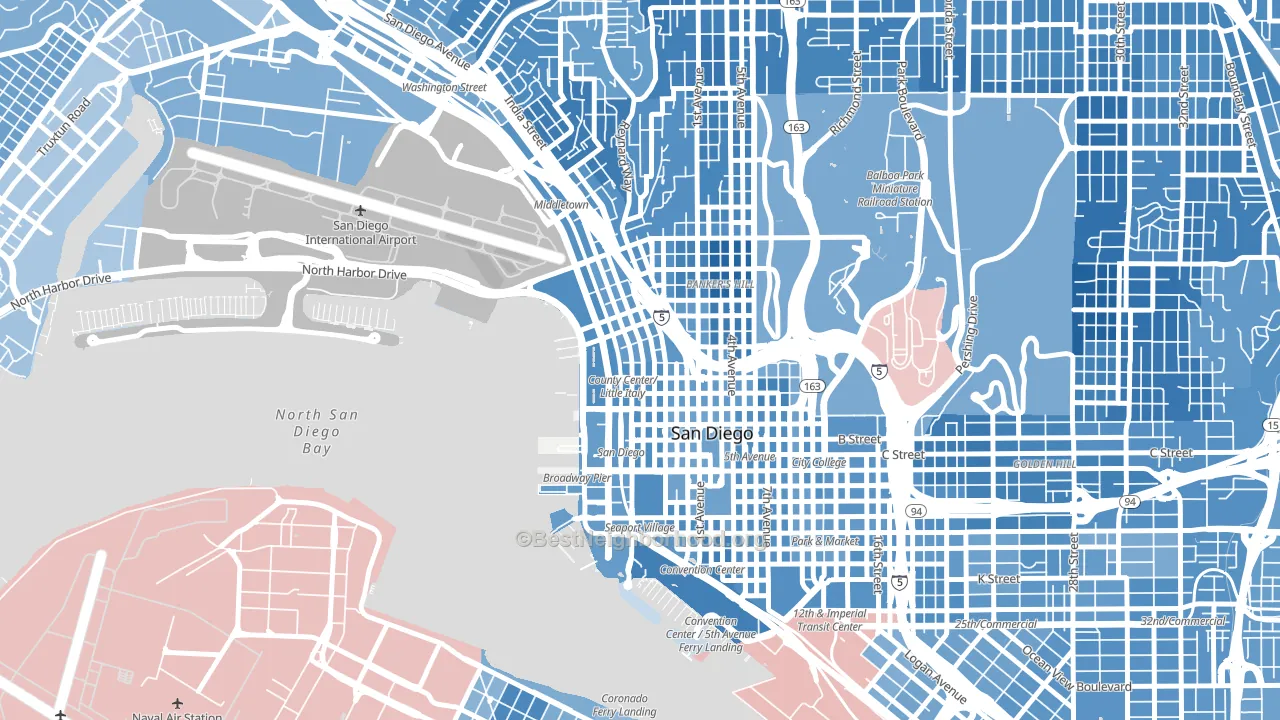
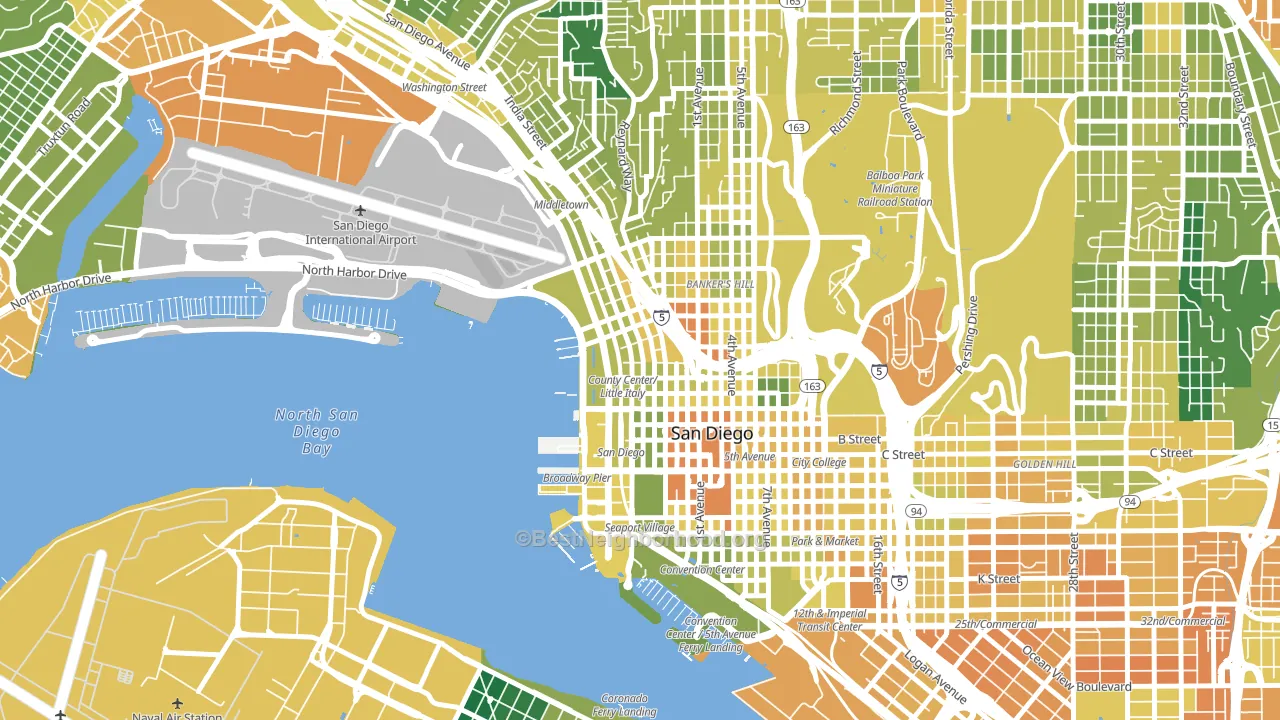
About 58% of adults in Little Italy typically vote, near the U.S. average of about 62%. Among adults in Little Italy, ~41% vote Democratic, ~17% Republican, and ~42% don't vote. The map below shows estimated turnout by block group.
How Little Italy compares
Among neighborhoods within 5 miles, Little Italy leans more Democratic than 17 of 35 neighbors.
Little Italy runs about 20 points more Democratic than California as a whole.
Why Little Italy leans the way it does
This analysis examined 14,881 data points per neighborhood to find what predicts political lean and turnout. The items below are a few correlations that stood out for Little Italy, not a ranked or complete list of what matters most.
Dense areas vote Democratic. More than 99% of residents in Little Italy live in densely developed areas, about 64 points above the U.S. average of 36%. High college attainment predicts Democratic voting, and Little Italy sits in the top quarter (about 77%, above 95% of neighborhoods). A high never-married share predicts Democratic voting, and about 54% of adults in Little Italy have never been married, above 87% of neighborhoods.
Population density and Democratic lean
Places with high population density tend to lean Democratic; Little Italy, San Diego, CA sits in the top tenth nationally on this measure.
Why turnout in Little Italy looks the way it does
Renters vote less often than owners. About 80% of households in Little Italy rent, about 55 points above the U.S. average of 25%. Strong routine healthcare access lines up with higher turnout, and Little Italy sits in the top quarter on routine-care measures. Learn more about the findings and methodology on the political spectrum map.
Nearby Neighborhoods
- Columbia San Diego, San Diego, CA D+37
- Cortez Hill, San Diego, CA D+50
- Park West, San Diego, CA D+54
- Marina, San Diego, CA D+45
- Core, San Diego, CA D+43
- East Village, San Diego, CA D+44
- Middletown, San Diego, CA D+47
- Sherman Heights, San Diego, CA D+45
- Hillcrest, San Diego, CA D+61
- Balboa Park, San Diego, CA D+58
Neighborhoods with Similar Populations
- Kashmere Gardens, Houston, TX D+70
- Normandy Isles, North Bay Village, FL R+4
- Pocono Farms, Tobyhanna, PA D+28
- Southeast, Helena, MT D+22
- Rancho El Dorado, Silver Bell, AZ R+6
- Nevin Community, Charlotte, NC D+67
- Center Bluff, Peoria, IL D+47
- Greenwood Forest, Houston, TX D+11
- Valencia, Buckeye, AZ R+14
- Fairgrounds, New Orleans, LA D+68
Sources and methodology
Precinct-level voting records used to fit the model come from California Secretary of State, Elections, distributed by the Voting and Election Science Team. Demographic inputs come from the U.S. Census Bureau (ACS 5-year estimates and the 2020 Decennial Census). Health and environmental inputs come from the CDC (PLACES and the Environmental Justice Index). Land cover comes from the USGS and EPA. Election-day and lead-up weather come from PRISM 4km daily grids and the NOAA Global Historical Climatology Network. Mail-voting and election-administration patterns come from the MIT Election Lab's Survey of the Performance of American Elections. Block-group crime detail comes from CrimeGrade. Internet data and modeling support provided by ISPreports.org.
Modeling and analysis by the BestNeighborhood data science team. Full methodology and findings: political spectrum map.
Methodology reviewed by the BestNeighborhood data team. Last updated May 2026.