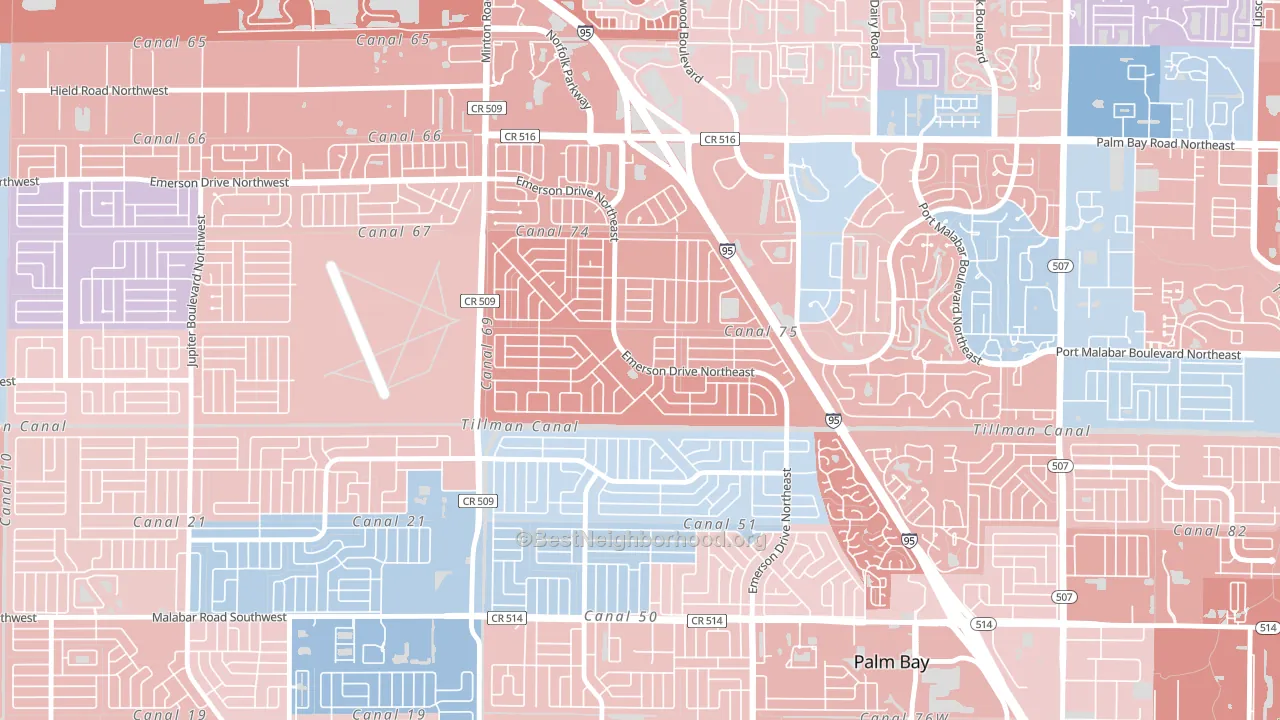
Lockmar Estates leans Republican by roughly 16 points: about 42% of voters vote Democratic and 58% Republican.
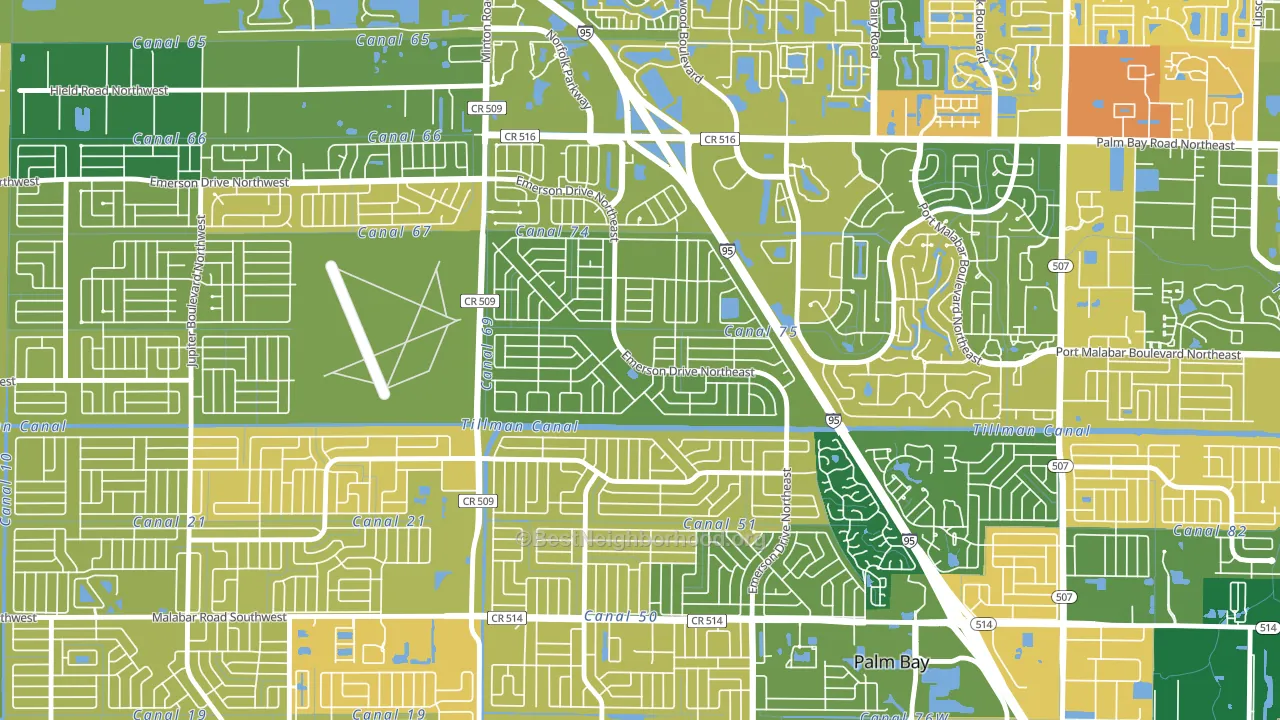
About 76% of adults in Lockmar Estates typically vote, above the U.S. average of about 62%. Among adults in Lockmar Estates, ~32% vote Democratic, ~44% Republican, and ~24% don't vote. The map below shows estimated turnout by block group.
How Lockmar Estates compares
Politically, Lockmar Estates sits close to the rest of Florida.
Politics vary noticeably by block within Lockmar Estates. The west side is the most Republican-leaning (R+19) and the south side is the least Republican-leaning (R+9), a spread of about 11 points.
Why Lockmar Estates leans the way it does
This analysis examined 14,881 data points per neighborhood to find what predicts political lean and turnout. The items below are a few correlations that stood out for Lockmar Estates, not a ranked or complete list of what matters most.
Areas with many family households vote Republican. About 77% of households in Lockmar Estates are family households, about 10 points above the U.S. average of 67%.
Park access and Republican lean
Places with low park coverage tend to lean Republican; Lockmar Estates, Palm Bay, FL sits in the bottom tenth nationally on this measure. Park access does not change how people vote; it tends to track denser, higher-income areas.
Why turnout in Lockmar Estates looks the way it does
Areas with strong routine healthcare access turn out at higher rates. Lockmar Estates is in the top quarter nationally for routine-care measures such as insurance coverage, preventive screenings, and dental visits. The dental-visit rate here is about 61%. Homeowners vote more often than renters, and about 88% of households in Lockmar Estates own their home, above 85% of neighborhoods. Learn more about the findings and methodology on the political spectrum map.
Nearby Neighborhoods
- Holiday Park, Palm Bay, FL R+9
- South Beach, Fort Pierce, FL R+24
- Esprit, St. Cloud, FL R+14
- Cape Orl Estates, Wedgefield, FL R+16
- Raintree, Kissimmee, FL R+5
- Lake Nona, Orlando, FL R+4
- Avalon Park Village, Alafaya, FL Even
- Bal Bay, Orlando, FL Even
- Avalon Park Northwest Village, Alafaya, FL D+5
- Northlake Park at Lake Nona, Orlando, FL R+6
Neighborhoods with Similar Populations
- Edmondson Heights, Woodlawn, MD D+81
- Poinciana-Village 3, Poinciana, FL D+14
- Glenroy Village, Indianapolis, IN R+15
- Heron Bay, San Leandro, CA D+32
- Hembstead, Charlotte, NC D+8
- 4th Ward, Portsmouth, OH R+25
- Carver, Mobile, AL D+87
- West Leominster, Leominster, MA D+12
- Factoria, Bellevue, WA D+40
- Donaldson Run, Arlington, VA D+57
Sources and methodology
Precinct-level voting records used to fit the model come from Florida Division of Elections, distributed by the Voting and Election Science Team. Demographic inputs come from the U.S. Census Bureau (ACS 5-year estimates and the 2020 Decennial Census). Health and environmental inputs come from the CDC (PLACES and the Environmental Justice Index). Land cover comes from the USGS and EPA. Election-day and lead-up weather come from PRISM 4km daily grids and the NOAA Global Historical Climatology Network. Mail-voting and election-administration patterns come from the MIT Election Lab's Survey of the Performance of American Elections. Block-group crime detail comes from CrimeGrade. Internet data and modeling support provided by ISPreports.org.
Modeling and analysis by the BestNeighborhood data science team. Full methodology and findings: political spectrum map.
Methodology reviewed by the BestNeighborhood data team. Last updated May 2026.