Midtown is a Democratic stronghold. About 92% of voters here vote Democratic and 8% Republican.
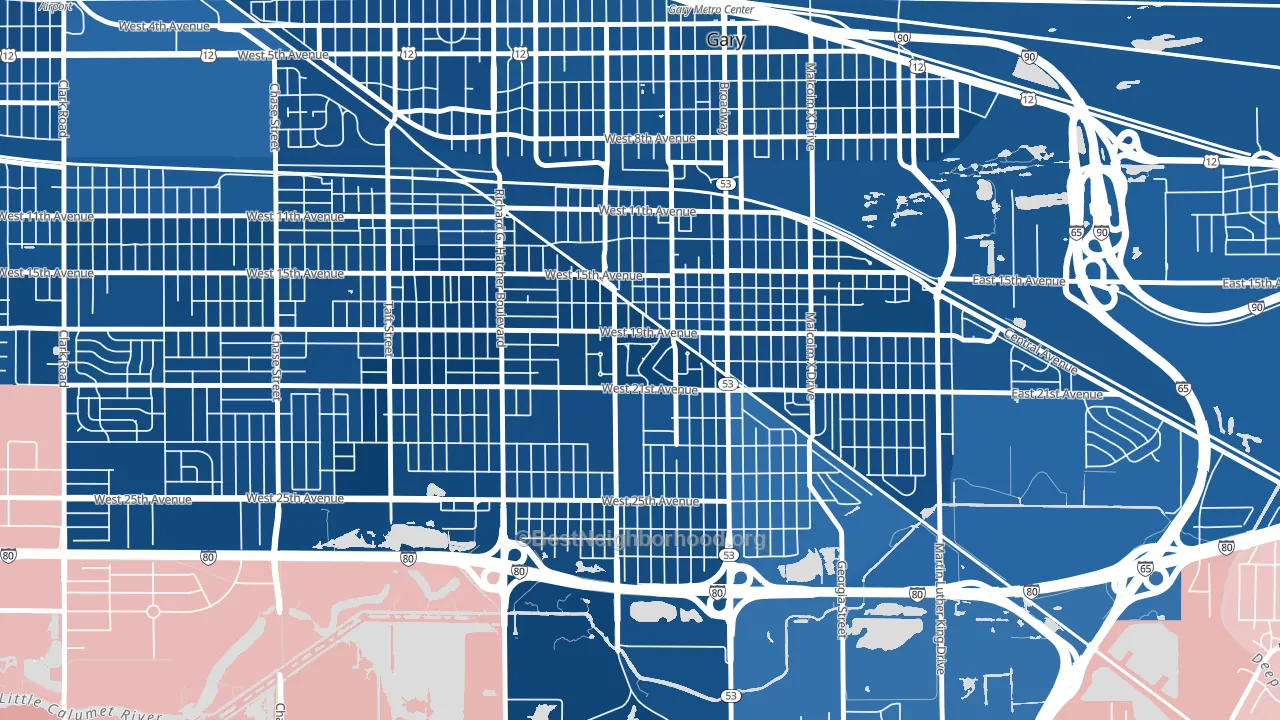
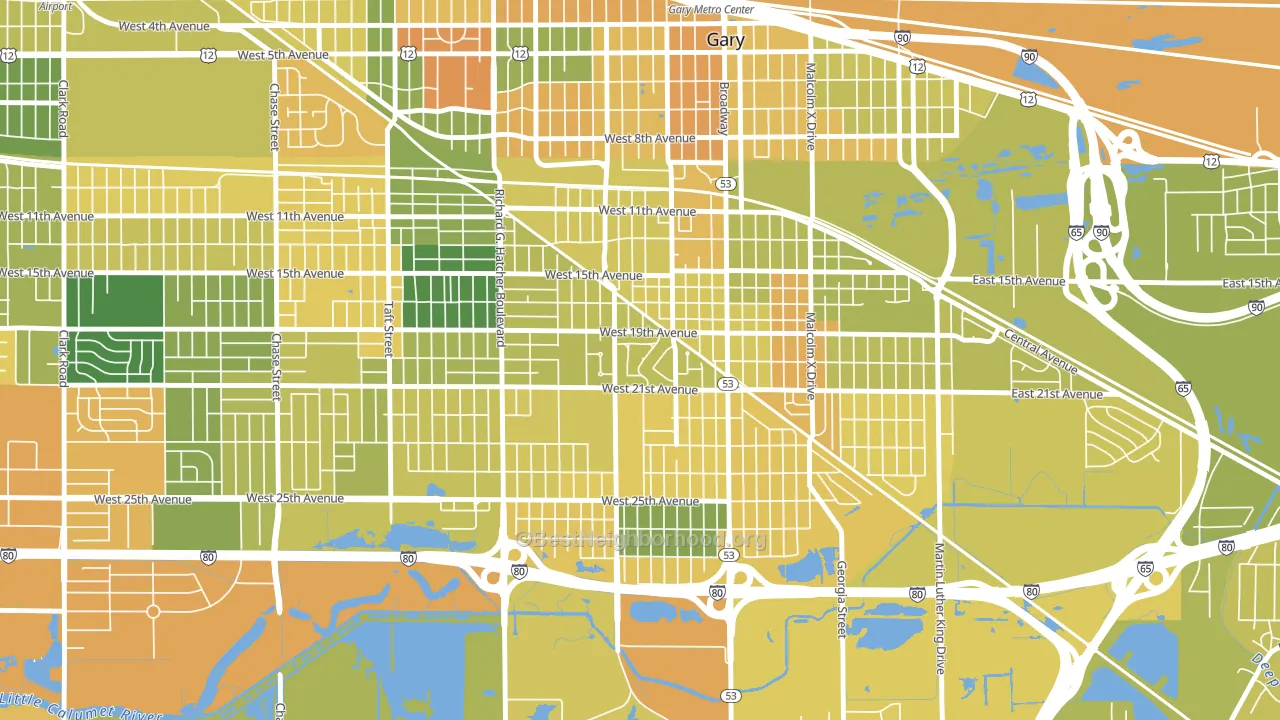
About 57% of adults in Midtown typically vote, near the U.S. average of about 62%. Among adults in Midtown, ~52% vote Democratic, ~5% Republican, and ~43% don't vote. The map below shows estimated turnout by block group.
How Midtown compares
Among neighborhoods within 5 miles, Midtown leans more Democratic than 6 of 7 neighbors.
Midtown runs about 103 points more Democratic than Indiana as a whole. Indiana leans Republican overall, while Midtown is one of the few Democratic-leaning pockets.
Why Midtown leans the way it does
This analysis examined 14,881 data points per neighborhood to find what predicts political lean and turnout. The items below are a few correlations that stood out for Midtown, not a ranked or complete list of what matters most.
Midtown votes against the grain of Indiana. Indiana leans Republican overall, while Midtown runs about 103 points more Democratic.
Paved land cover and Democratic lean
Places with extensive paved surfaces tend to lean Democratic; Midtown, Gary, IN sits in the top quarter nationally on this measure. Paved ground does not change how people vote; it mostly reflects how urban and built-up a place is.
Why turnout in Midtown looks the way it does
Areas with high food insecurity turn out at lower rates. About 46% of adults in Midtown report food insecurity, about 30 points above the U.S. average of 16%. Limited routine healthcare access lines up with lower turnout, and Midtown sits in the bottom quarter on routine-care measures. High-crime urban areas turn out at lower rates, and Midtown sits in the top 15% on a violent-crime measure. Learn more about the findings and methodology on the political spectrum map.
Nearby Neighborhoods
- Pulaski, Gary, IN D+83
- Downtown West, Gary, IN D+84
- Tolleston, Gary, IN D+82
- Tarrytown, Gary, IN D+82
- Glen Park, Gary, IN D+79
- Brunswick, Gary, IN D+80
- Aetna, Gary, IN D+76
- Turner-Meyn Park, Hammond, IN D+19
- Forestdale, Hammond, IN D+29
- Columbia Center, Hammond, IN D+38
Neighborhoods with Similar Populations
- The Hill Section, Scranton, PA D+23
- Downtown Lincoln, Lincoln, NE D+42
- Elyria Swansea, Denver, CO D+40
- Village 11, Sacramento, CA D+32
- Arlington-East Falls, Arlington, VA D+57
- Hunters Green, Tampa, FL D+9
- Fairmont Park, Des Moines, IA D+7
- Southside, Binghamton, NY D+26
- Heritage Hill, Grand Rapids, MI D+61
- Croydon Park, Rockville, MD D+46
Sources and methodology
Precinct-level voting records used to fit the model come from Indiana Secretary of State, Elections, distributed by the Voting and Election Science Team. Demographic inputs come from the U.S. Census Bureau (ACS 5-year estimates and the 2020 Decennial Census). Health and environmental inputs come from the CDC (PLACES and the Environmental Justice Index). Land cover comes from the USGS and EPA. Election-day and lead-up weather come from PRISM 4km daily grids and the NOAA Global Historical Climatology Network. Mail-voting and election-administration patterns come from the MIT Election Lab's Survey of the Performance of American Elections. Block-group crime detail comes from CrimeGrade. Internet data and modeling support provided by ISPreports.org.
Modeling and analysis by the BestNeighborhood data science team. Full methodology and findings: political spectrum map.
Methodology reviewed by the BestNeighborhood data team. Last updated May 2026.