Croydon Park leans heavily Democratic by roughly 46 points: about 73% of voters vote Democratic and 27% Republican.
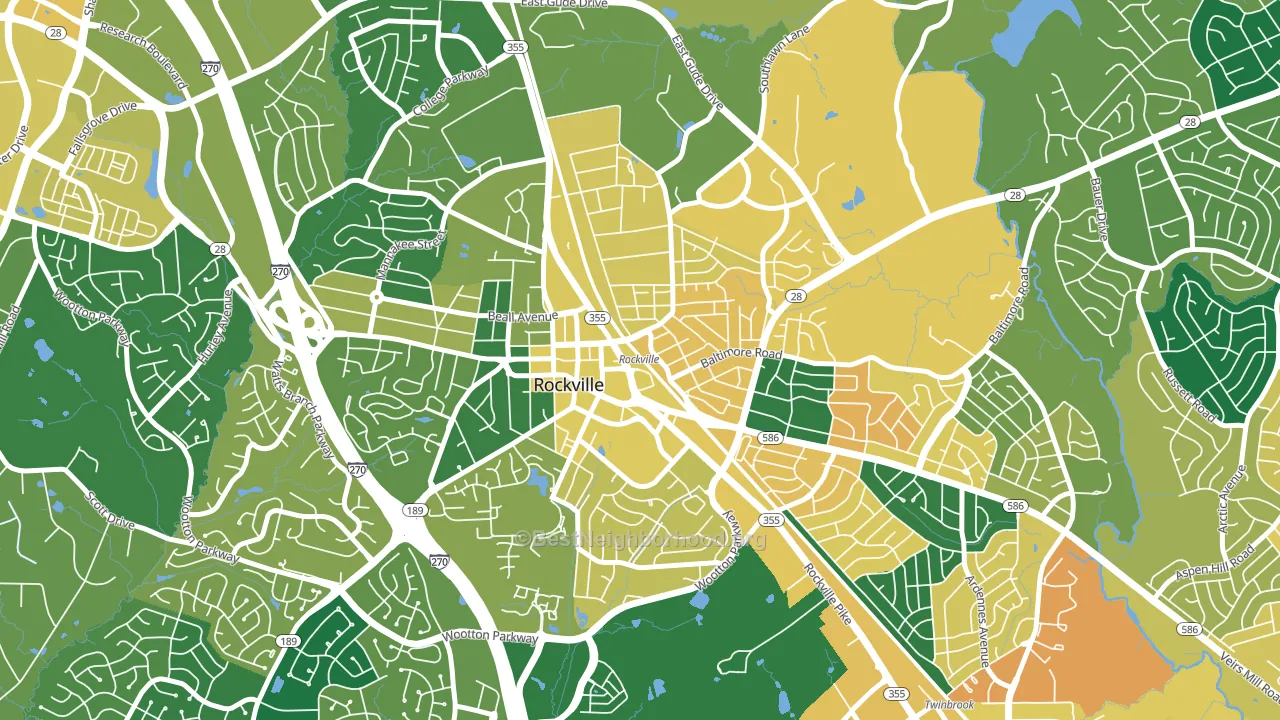
About 54% of adults in Croydon Park typically vote, below the U.S. average of about 62%. Among adults in Croydon Park, ~40% vote Democratic, ~15% Republican, and ~45% don't vote. The map below shows estimated turnout by block group.
How Croydon Park compares
Among neighborhoods within 5 miles, Croydon Park is the least Democratic-leaning.
Croydon Park runs about 17 points more Democratic than Maryland as a whole.
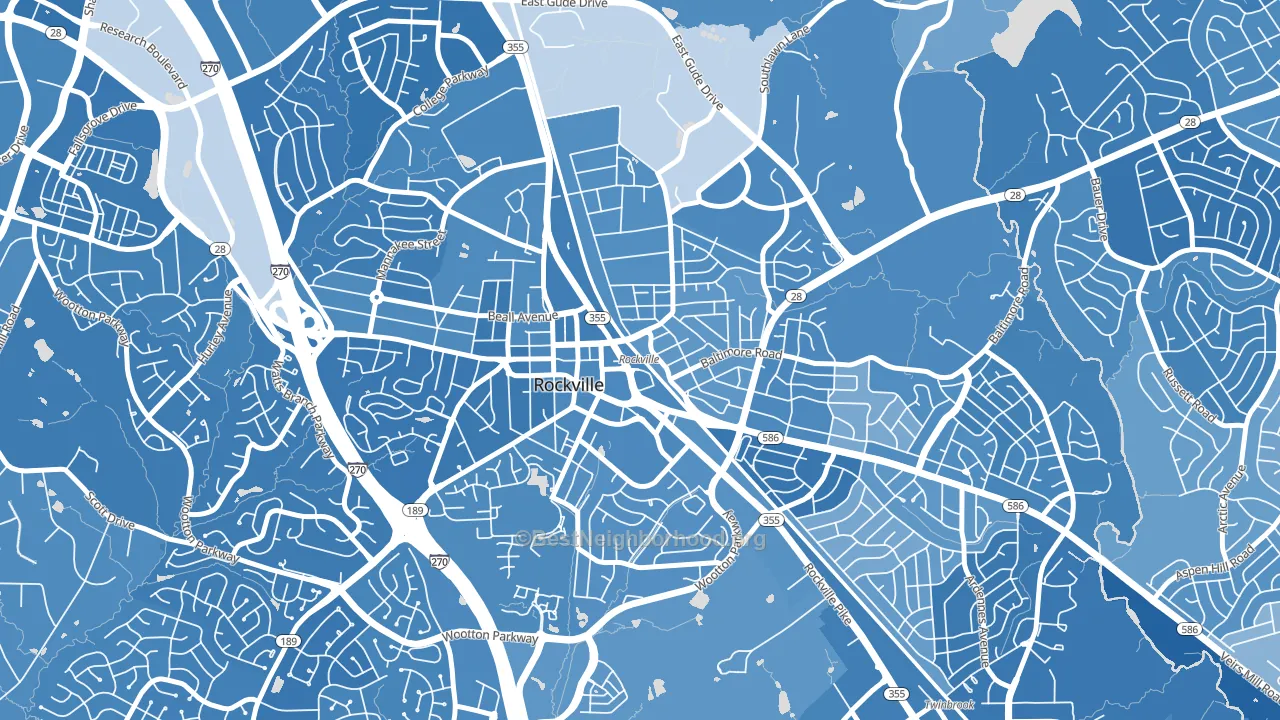
Politics vary noticeably by block within Croydon Park. The south side is the most Democratic-leaning (D+52) and the southeast side is the least Democratic-leaning (D+37), a spread of about 15 points.
Why Croydon Park leans the way it does
This analysis examined 14,881 data points per neighborhood to find what predicts political lean and turnout. The items below are a few correlations that stood out for Croydon Park, not a ranked or complete list of what matters most.
Density combined with diversity predicts Democratic voting. Non-Hispanic white share in Croydon Park is about 42%, about 31 points below the U.S. average of 72%.
Walkability and Democratic lean
Places with a highly walkable street grid tend to lean Democratic; Croydon Park, Rockville, MD sits in the top quarter nationally on this measure. A walkable street grid does not change how people vote; it mostly reflects how urban a place is.
Why turnout in Croydon Park looks the way it does
Crowded housing lines up with lower turnout. About 6% of homes in Croydon Park have more than one occupant per room, above 82% of neighborhoods. Learn more about the findings and methodology on the political spectrum map.
Nearby Neighborhoods
- Silver Rock, Rockville, MD D+46
- West End Park, Rockville, MD D+55
- North Kensington, Kensington, MD D+58
- Wheaton-Glenmont, Wheaton, MD D+51
- Forest Glen, Silver Spring, MD D+75
- Darnestown, Gaithersburg, MD D+25
- Barnaby Woods, Washington, DC D+74
- Takoma Park, Washington, DC D+84
- Chevy Chase, Washington, DC D+79
- Carroll Manor, Takoma Park, MD D+84
Neighborhoods with Similar Populations
- Firthtown, Phillipsburg, NJ D+8
- Heller Park, Tulsa, OK D+19
- Sunshine Gardens, South San Francisco, CA D+41
- Hunters Green, Tampa, FL D+9
- Village 11, Sacramento, CA D+32
- Arlington-East Falls, Arlington, VA D+57
- Elyria Swansea, Denver, CO D+40
- Downtown Lincoln, Lincoln, NE D+42
- Mokapu, Kaneohe Station, HI Even
- The Hill Section, Scranton, PA D+23
Sources and methodology
Precinct-level voting records used to fit the model come from Maryland State Board of Elections, distributed by the Voting and Election Science Team. Demographic inputs come from the U.S. Census Bureau (ACS 5-year estimates and the 2020 Decennial Census). Health and environmental inputs come from the CDC (PLACES and the Environmental Justice Index). Land cover comes from the USGS and EPA. Election-day and lead-up weather come from PRISM 4km daily grids and the NOAA Global Historical Climatology Network. Mail-voting and election-administration patterns come from the MIT Election Lab's Survey of the Performance of American Elections. Block-group crime detail comes from CrimeGrade. Internet data and modeling support provided by ISPreports.org.
Modeling and analysis by the BestNeighborhood data science team. Full methodology and findings: political spectrum map.
Methodology reviewed by the BestNeighborhood data team. Last updated May 2026.