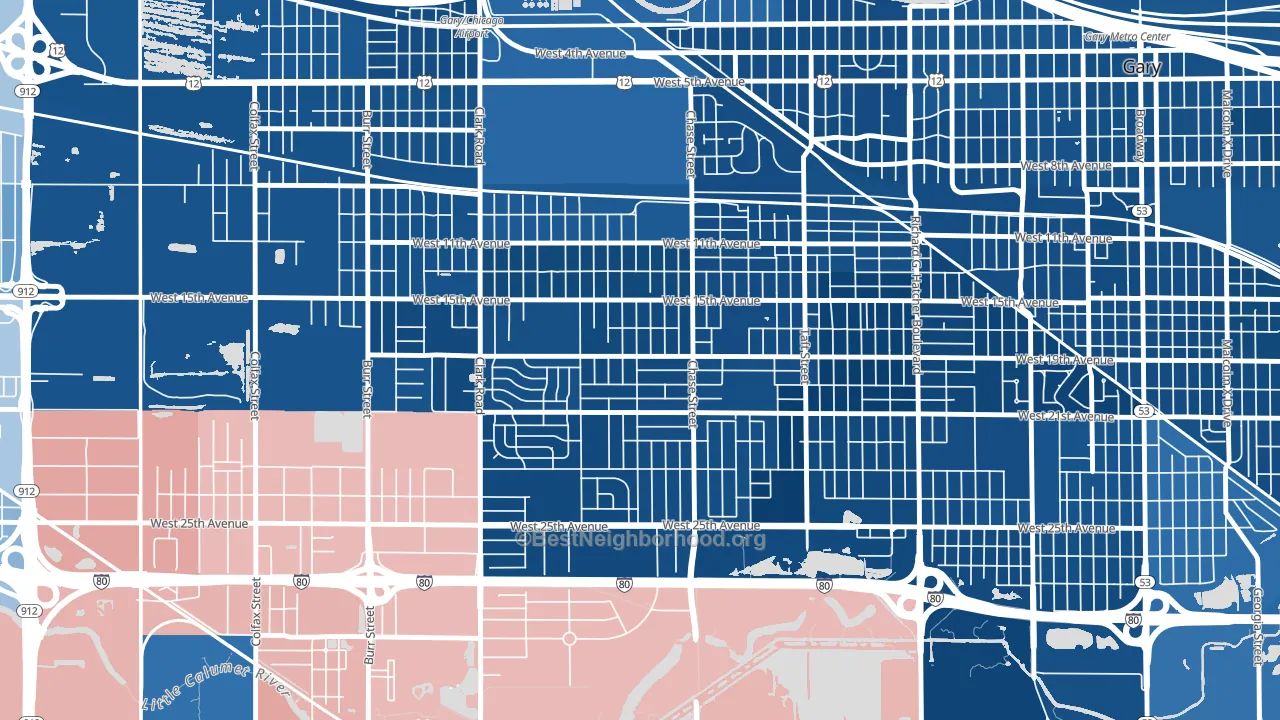
Tolleston is a Democratic stronghold. About 91% of voters here vote Democratic and 9% Republican.
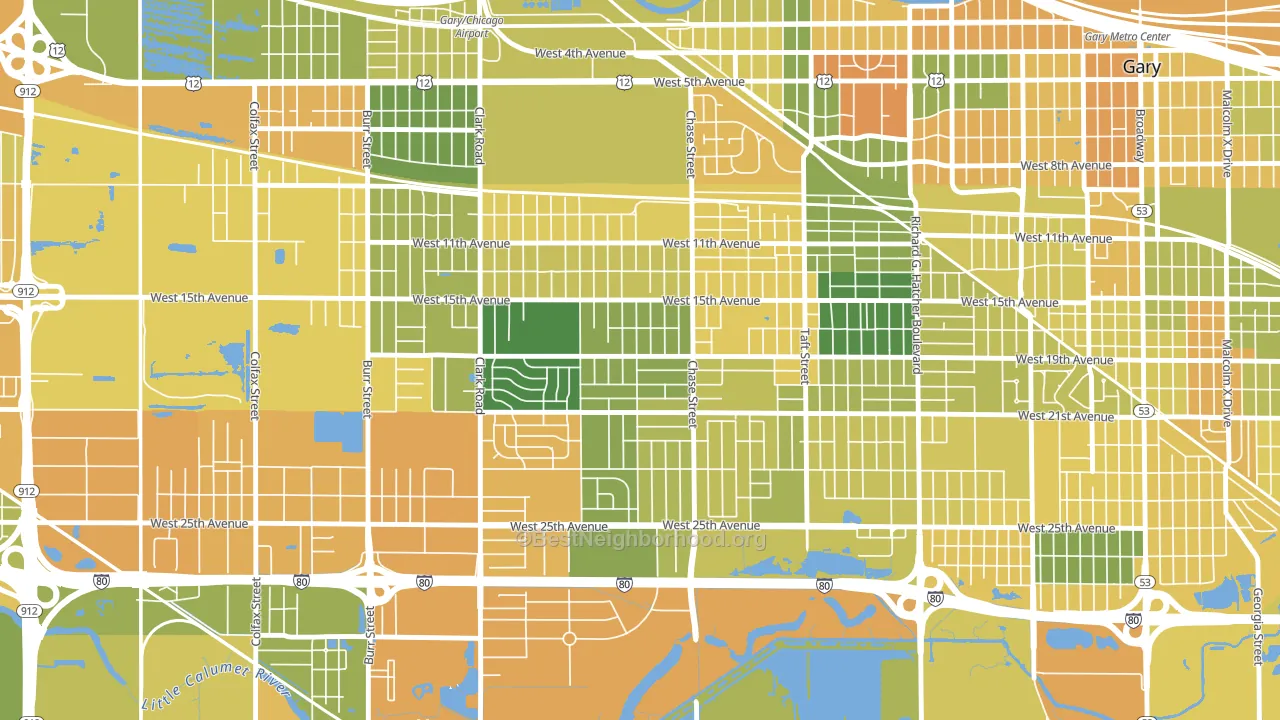
About 59% of adults in Tolleston typically vote, near the U.S. average of about 62%. Among adults in Tolleston, ~54% vote Democratic, ~5% Republican, and ~41% don't vote. The map below shows estimated turnout by block group.
How Tolleston compares
Among neighborhoods within 5 miles, Tolleston leans more Democratic than 4 of 8 neighbors.
Tolleston runs about 101 points more Democratic than Indiana as a whole. Indiana leans Republican overall, while Tolleston is one of the few Democratic-leaning pockets.
Politics vary noticeably by block within Tolleston. The south side is the most Democratic-leaning (D+89) and the southwest side is the least Democratic-leaning (D+70), a spread of about 19 points.
Why Tolleston leans the way it does
This analysis examined 14,881 data points per neighborhood to find what predicts political lean and turnout. The items below are a few correlations that stood out for Tolleston, not a ranked or complete list of what matters most.
Tolleston votes against the grain of Indiana. Indiana leans Republican overall, while Tolleston runs about 101 points more Democratic.
Food insecurity and voter turnout
Places with high food insecurity tend to turn out at a lower rate; Tolleston, Gary, IN sits in the top tenth nationally on this measure. Food insecurity does not directly drive turnout; it reflects economic hardship, which lines up with lower voting.
Why turnout in Tolleston looks the way it does
Areas with high food insecurity turn out at lower rates. About 42% of adults in Tolleston report food insecurity, about 25 points above the U.S. average of 16%. Low high-school completion lines up with lower turnout, and about 85% of adults in Tolleston have completed high school, below 76% of neighborhoods. Learn more about the findings and methodology on the political spectrum map.
Nearby Neighborhoods
- Tarrytown, Gary, IN D+82
- Downtown West, Gary, IN D+84
- Brunswick, Gary, IN D+80
- Midtown, Gary, IN D+84
- Pulaski, Gary, IN D+83
- Glen Park, Gary, IN D+79
- Turner-Meyn Park, Hammond, IN D+19
- Forestdale, Hammond, IN D+29
- Aetna, Gary, IN D+76
- Columbia Center, Hammond, IN D+38
Neighborhoods with Similar Populations
- River Park, South Bend, IN D+21
- Toddville Road, Charlotte, NC D+64
- Near Northeast, Syracuse, NY D+48
- University Village, Chicago, IL D+67
- Wolf Pen Creek District, College Station, TX D+30
- Mt Eden, Hayward, CA D+30
- Powderhorn Park, Minneapolis, MN D+73
- Broadview, Seattle, WA D+63
- Leslie, Decatur, GA D+84
- Southland Deerfield Open Gates, Lexington, KY D+30
Sources and methodology
Precinct-level voting records used to fit the model come from Indiana Secretary of State, Elections, distributed by the Voting and Election Science Team. Demographic inputs come from the U.S. Census Bureau (ACS 5-year estimates and the 2020 Decennial Census). Health and environmental inputs come from the CDC (PLACES and the Environmental Justice Index). Land cover comes from the USGS and EPA. Election-day and lead-up weather come from PRISM 4km daily grids and the NOAA Global Historical Climatology Network. Mail-voting and election-administration patterns come from the MIT Election Lab's Survey of the Performance of American Elections. Block-group crime detail comes from CrimeGrade. Internet data and modeling support provided by ISPreports.org.
Modeling and analysis by the BestNeighborhood data science team. Full methodology and findings: political spectrum map.
Methodology reviewed by the BestNeighborhood data team. Last updated May 2026.