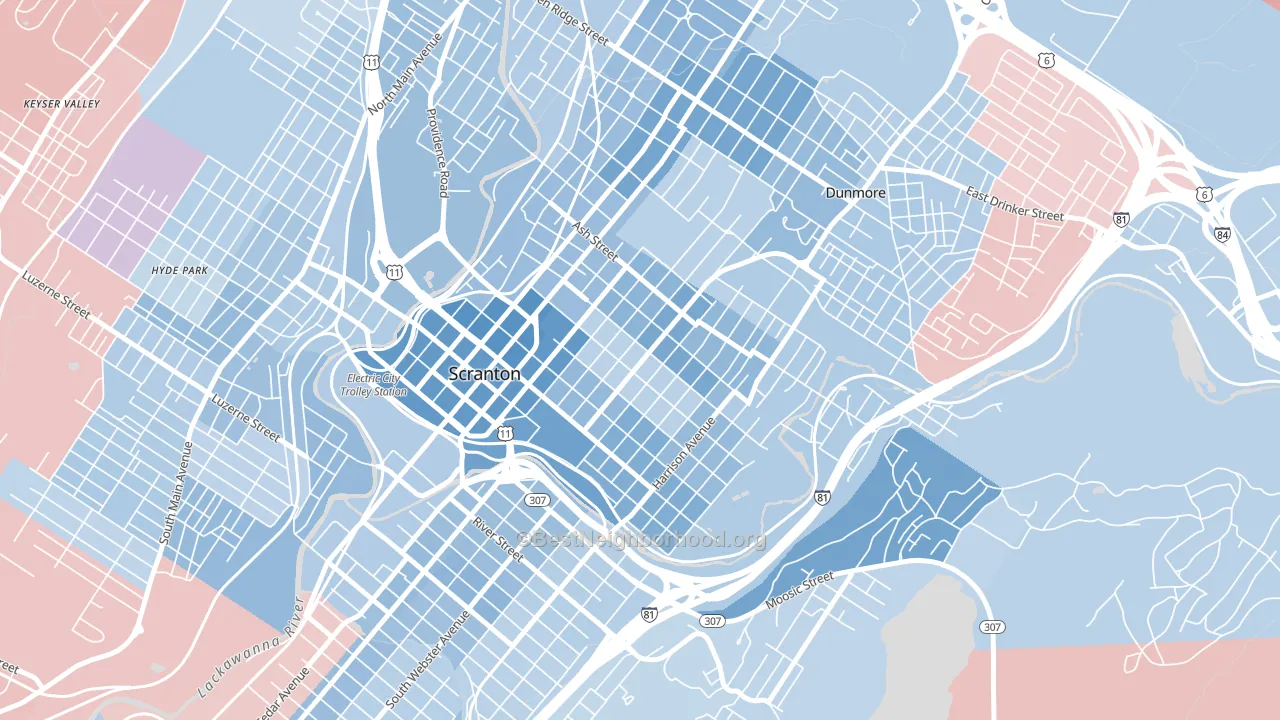
The Hill Section leans Democratic by roughly 22 points: about 61% of voters vote Democratic and 39% Republican.
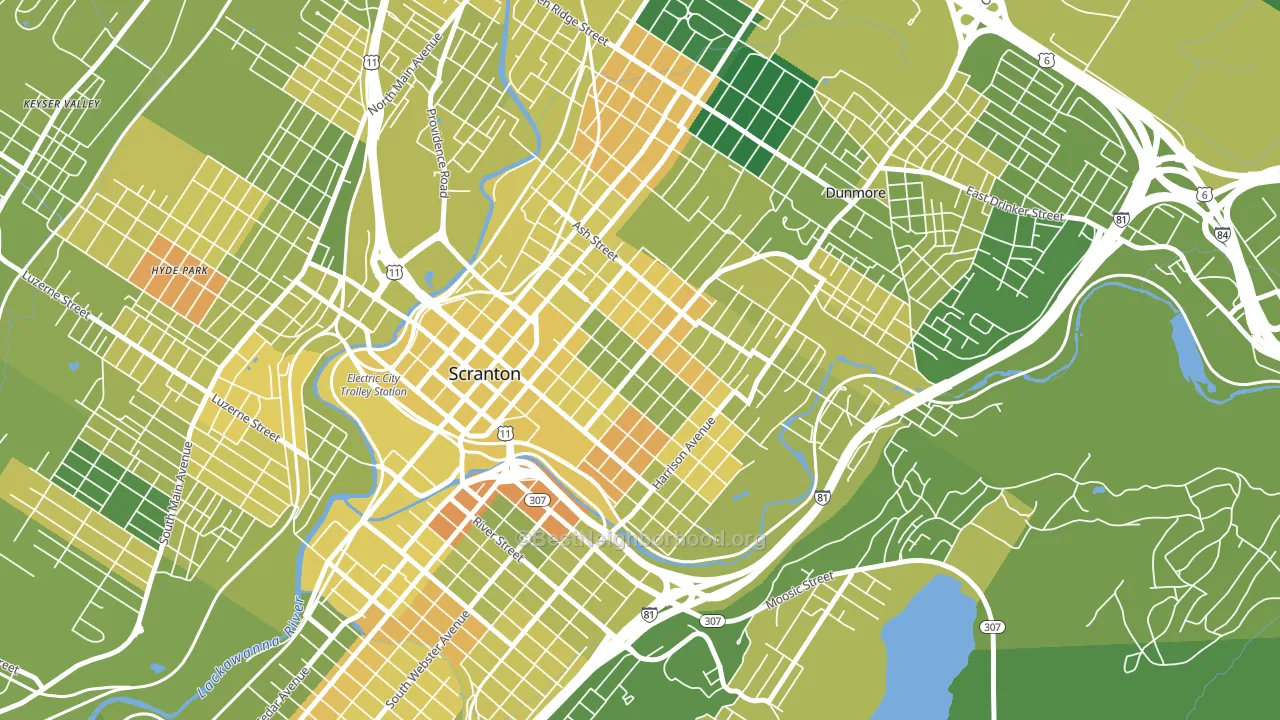
About 54% of adults in The Hill Section typically vote, below the U.S. average of about 62%. Among adults in The Hill Section, ~33% vote Democratic, ~21% Republican, and ~46% don't vote. The map below shows estimated turnout by block group.
How The Hill Section compares
Among neighborhoods within 5 miles, The Hill Section leans more Democratic than 6 of 7 neighbors.
The Hill Section runs about 24 points more Democratic than Pennsylvania as a whole. Pennsylvania is roughly evenly split, and The Hill Section sits clearly on the Democratic side.
Politics vary noticeably by block within The Hill Section. The west side is the most Democratic-leaning (D+29) and the north side is the least Democratic-leaning (D+18), a spread of about 12 points.
Why The Hill Section leans the way it does
This analysis examined 14,881 data points per neighborhood to find what predicts political lean and turnout. The items below are a few correlations that stood out for The Hill Section, not a ranked or complete list of what matters most.
The Hill Section votes against the grain of Pennsylvania. Pennsylvania is roughly evenly split, while The Hill Section runs about 24 points more Democratic. A high never-married share predicts Democratic voting, and about 48% of adults in The Hill Section have never been married, above 78% of neighborhoods.
Population density and Democratic lean
Places with high population density tend to lean Democratic; The Hill Section, Scranton, PA sits in the top tenth nationally on this measure.
Why turnout in The Hill Section looks the way it does
Areas with low high-school completion turn out at lower rates. About 85% of adults in The Hill Section have completed high school, below 77% of neighborhoods. Learn more about the findings and methodology on the political spectrum map.
Nearby Neighborhoods
- Petersburg, Scranton, PA D+20
- Downtown, Scranton, PA D+28
- Green Ridge, Scranton, PA D+17
- South Side, Scranton, PA D+16
- Providence, Scranton, PA D+10
- West Side, Scranton, PA D+8
- The Plot, Scranton, PA D+13
- Parsons, Wilkes-Barre, PA R+9
- North End, Wilkes-Barre, PA D+16
- Mayflower, Wilkes-Barre, PA D+12
Neighborhoods with Similar Populations
- Downtown Lincoln, Lincoln, NE D+42
- Arlington-East Falls, Arlington, VA D+57
- Elyria Swansea, Denver, CO D+40
- Village 11, Sacramento, CA D+32
- Midtown, Gary, IN D+84
- Hunters Green, Tampa, FL D+9
- Fairmont Park, Des Moines, IA D+7
- Croydon Park, Rockville, MD D+46
- Firthtown, Phillipsburg, NJ D+8
- Southside, Binghamton, NY D+26
Sources and methodology
Precinct-level voting records used to fit the model come from Pennsylvania Department of State, Bureau of Elections, distributed by the Voting and Election Science Team. Demographic inputs come from the U.S. Census Bureau (ACS 5-year estimates and the 2020 Decennial Census). Health and environmental inputs come from the CDC (PLACES and the Environmental Justice Index). Land cover comes from the USGS and EPA. Election-day and lead-up weather come from PRISM 4km daily grids and the NOAA Global Historical Climatology Network. Mail-voting and election-administration patterns come from the MIT Election Lab's Survey of the Performance of American Elections. Block-group crime detail comes from CrimeGrade. Internet data and modeling support provided by ISPreports.org.
Modeling and analysis by the BestNeighborhood data science team. Full methodology and findings: political spectrum map.
Methodology reviewed by the BestNeighborhood data team. Last updated May 2026.