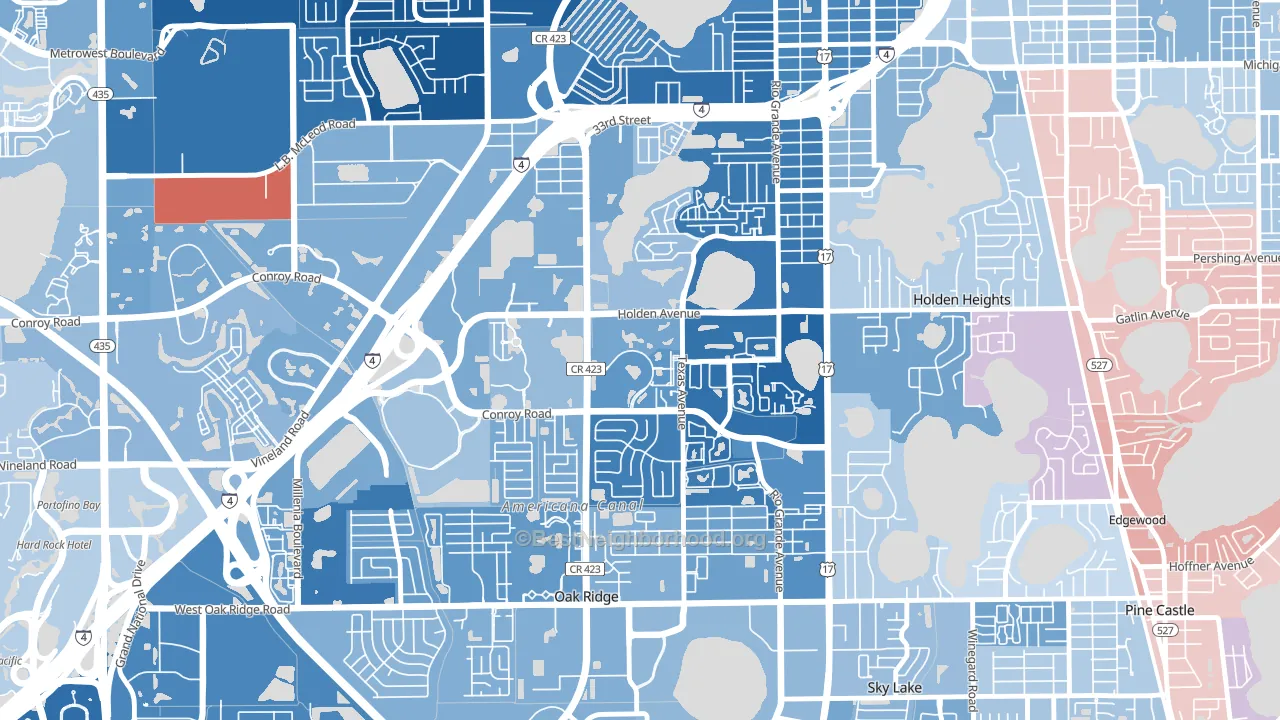
Park Central leans heavily Democratic by roughly 36 points: about 68% of voters vote Democratic and 32% Republican.
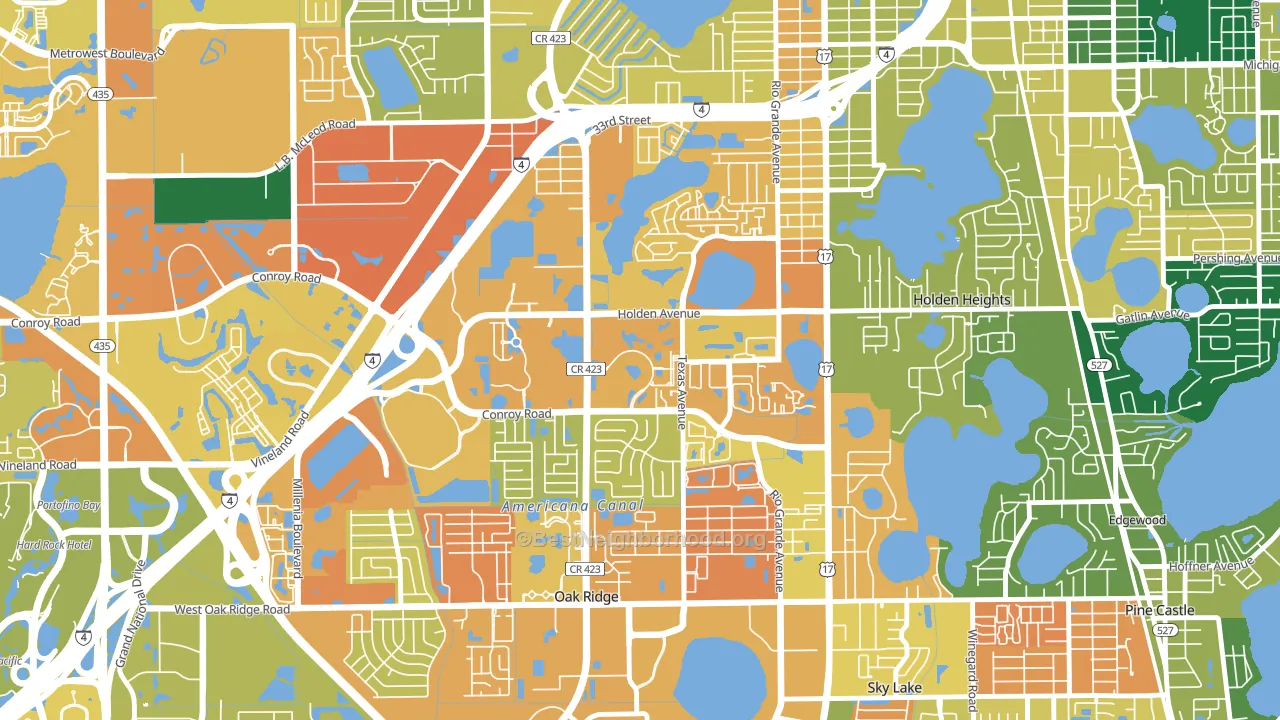
About 37% of adults in Park Central typically vote, below the U.S. average of about 62%. Among adults in Park Central, ~25% vote Democratic, ~12% Republican, and ~63% don't vote. The map below shows estimated turnout by block group.
How Park Central compares
Among neighborhoods within 5 miles, Park Central leans more Democratic than 10 of 17 neighbors.
Park Central runs about 50 points more Democratic than Florida as a whole. Florida leans Republican overall, while Park Central is one of the few Democratic-leaning pockets.
Why Park Central leans the way it does
This analysis examined 14,881 data points per neighborhood to find what predicts political lean and turnout. The items below are a few correlations that stood out for Park Central, not a ranked or complete list of what matters most.
Park Central votes against the grain of Florida. Florida leans Republican overall, while Park Central runs about 50 points more Democratic. A high never-married share predicts Democratic voting, and about 61% of adults in Park Central have never been married, above 93% of neighborhoods.
Walkability and Democratic lean
Places with a highly walkable street grid tend to lean Democratic; Park Central, Orlando, FL sits in the top tenth nationally on this measure. A walkable street grid does not change how people vote; it mostly reflects how urban a place is.
Why turnout in Park Central looks the way it does
Areas with limited routine healthcare access turn out at lower rates. Park Central is in the bottom quarter nationally for routine-care measures such as insurance coverage, preventive screenings, and dental visits. Renters vote less often than owners, and about 86% of households in Park Central rent, compared to around 66% in nearby neighborhoods. Low high-school completion lines up with lower turnout, and more than 99% of adults in Park Central have completed high school, above 98% of neighborhoods. Learn more about the findings and methodology on the political spectrum map.
Nearby Neighborhoods
- Americana, Oak Ridge, FL D+57
- Tymber Skan on the Lake, Orlando, FL D+43
- Cannongate-Orlando, Oak Ridge, FL D+33
- Millenia, Orlando, FL D+34
- Rio Grande Park, Orlando, FL D+49
- Florida Center North, Orlando, FL D+24
- Richmond Heights-Orlando, Orlando, FL D+83
- Camellia Gardens, Orlando, FL D+57
- South Orange, Orlando, FL D+17
- Florida Center, Orlando, FL D+21
Neighborhoods with Similar Populations
- Larkinville, Buffalo, NY D+63
- Cloverleaf, Louisville, KY D+10
- Turtle Run, Coral Springs, FL D+24
- Noralto, Sacramento, CA D+34
- Downtown Waterford, Waterford, CA R+23
- Hewitt Area, Greensboro, NC D+60
- Midtown, Reno, NV D+36
- Old Palo Alto, Palo Alto, CA D+69
- San Pedro, Robstown, TX D+19
- Nasons Corner, Portland, ME D+37
Sources and methodology
Precinct-level voting records used to fit the model come from Florida Division of Elections, distributed by the Voting and Election Science Team. Demographic inputs come from the U.S. Census Bureau (ACS 5-year estimates and the 2020 Decennial Census). Health and environmental inputs come from the CDC (PLACES and the Environmental Justice Index). Land cover comes from the USGS and EPA. Election-day and lead-up weather come from PRISM 4km daily grids and the NOAA Global Historical Climatology Network. Mail-voting and election-administration patterns come from the MIT Election Lab's Survey of the Performance of American Elections. Block-group crime detail comes from CrimeGrade. Internet data and modeling support provided by ISPreports.org.
Modeling and analysis by the BestNeighborhood data science team. Full methodology and findings: political spectrum map.
Methodology reviewed by the BestNeighborhood data team. Last updated May 2026.