Greenwood is a Democratic stronghold. About 81% of voters here vote Democratic and 19% Republican.
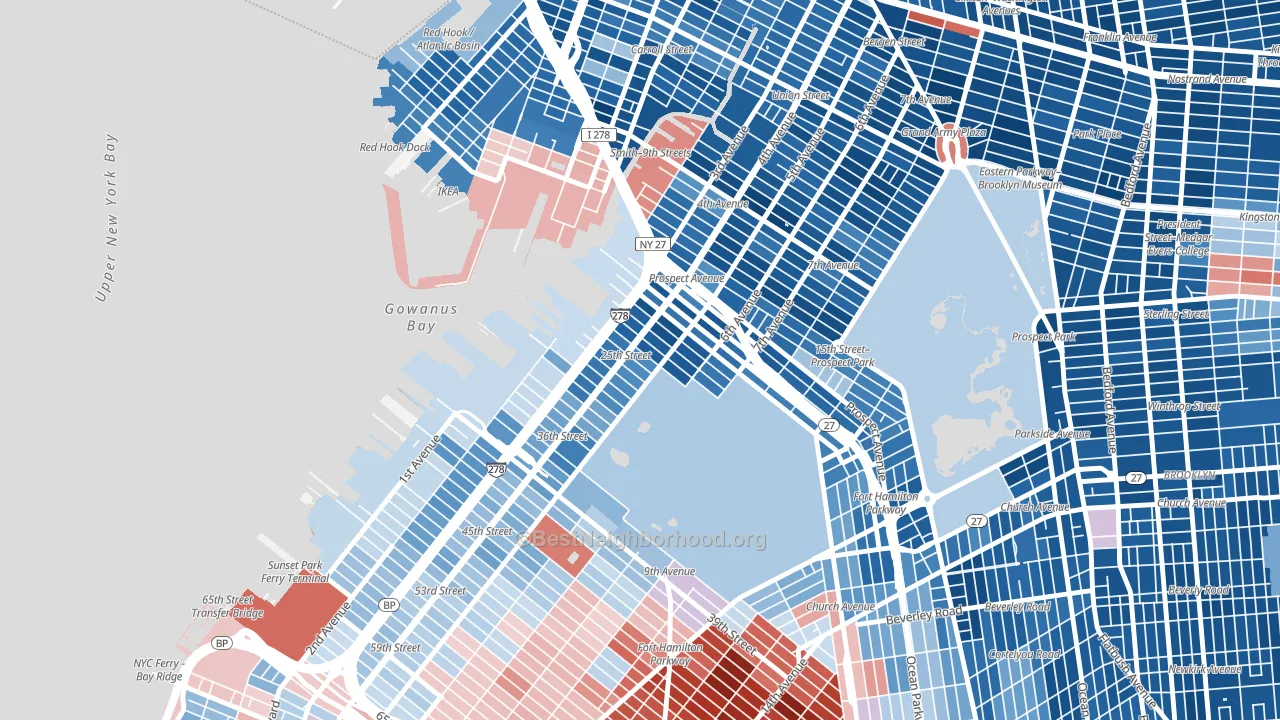
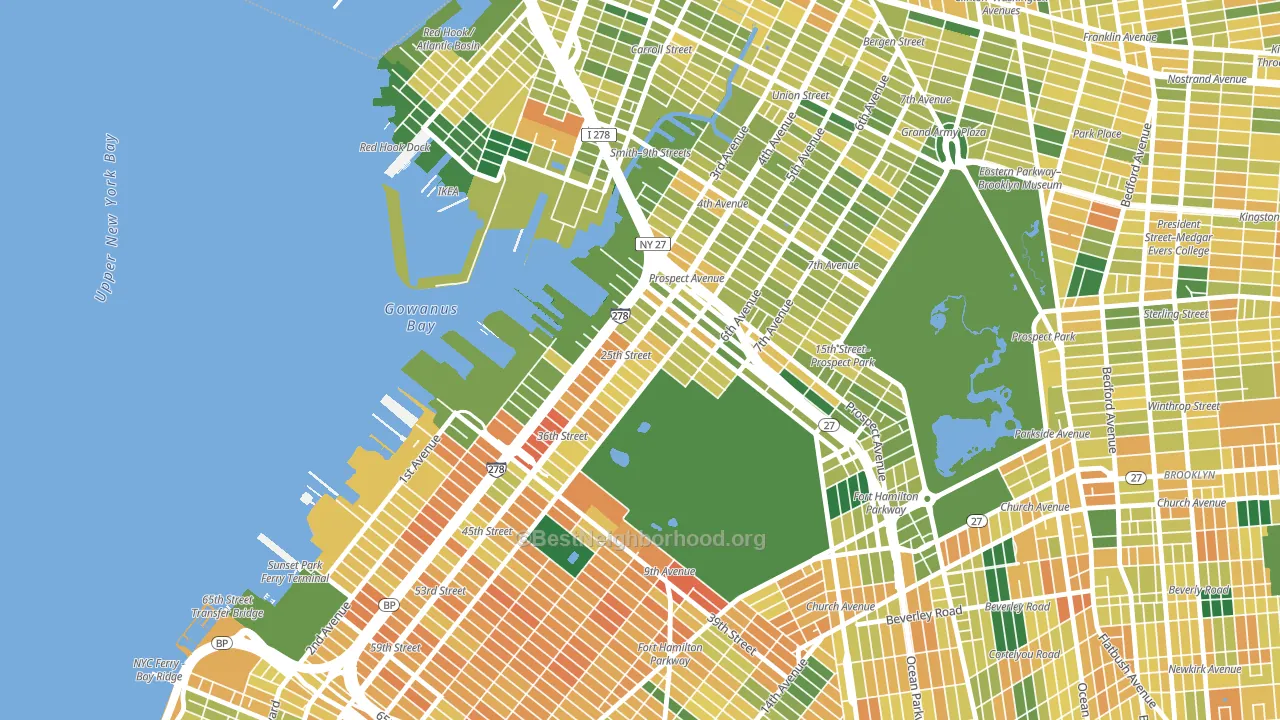
About 50% of adults in Greenwood typically vote, below the U.S. average of about 62%. Among adults in Greenwood, ~41% vote Democratic, ~10% Republican, and ~49% don't vote. The map below shows estimated turnout by block group.
How Greenwood compares
Among neighborhoods within 5 miles, Greenwood leans more Democratic than 18 of 42 neighbors.
Greenwood runs about 49 points more Democratic than New York as a whole.
Politics vary noticeably by block within Greenwood. The north side is the most Democratic-leaning (D+80) and the west side is the least Democratic-leaning (D+32), a spread of about 48 points.
Why Greenwood leans the way it does
This analysis examined 14,881 data points per neighborhood to find what predicts political lean and turnout. The items below are a few correlations that stood out for Greenwood, not a ranked or complete list of what matters most.
Areas with many never-married adults vote Democratic. About 48% of adults in Greenwood have never been married, modestly above similar-sized neighborhoods (around 41%).
Walkability and Democratic lean
Places with a highly walkable street grid tend to lean Democratic; Greenwood, Brooklyn, NY sits above the national average on this measure. A walkable street grid does not change how people vote; it mostly reflects how urban a place is.
Why turnout in Greenwood looks the way it does
Crowded housing lines up with lower turnout. About 10% of homes in Greenwood have more than one occupant per room, above 91% of neighborhoods. Renters vote less often than owners, and about 68% of households in Greenwood rent, about 43 points above the U.S. average of 25%. Low high-school completion lines up with lower turnout, and about 80% of adults in Greenwood have completed high school, below 85% of neighborhoods. Learn more about the findings and methodology on the political spectrum map.
Nearby Neighborhoods
- Park Slope, Brooklyn, NY D+78
- Carroll Gardens, Brooklyn, NY D+74
- Red Hook, Brooklyn, NY D+62
- Sunset Park, Brooklyn, NY D+13
- Borough Park, Brooklyn, NY R+33
- Columbia Street Waterfront District, Brooklyn, NY D+78
- Boerum Hill, Brooklyn, NY D+77
- Cobble Hill, Brooklyn, NY D+79
- Flatbush-Ditmas Park, Brooklyn, NY D+84
- Prospect Lefferts Gardens, Brooklyn, NY D+84
Neighborhoods with Similar Populations
- North Sutton Area, Manhattan, NY D+55
- City Heights West, San Diego, CA D+41
- Tampa Palms, Tampa, FL D+16
- Upper Clinton Hill, Newark, NJ D+80
- Park Hill, Denver, CO D+72
- Bellerose, Queens, NY D+7
- East Sacramento, Sacramento, CA D+59
- Jefferson, Cleveland, OH D+23
- South Southwest, San Antonio, TX D+21
- Brooklyn Heights, Brooklyn, NY D+75
Sources and methodology
Precinct-level voting records used to fit the model come from New York State Board of Elections, distributed by the Voting and Election Science Team. Demographic inputs come from the U.S. Census Bureau (ACS 5-year estimates and the 2020 Decennial Census). Health and environmental inputs come from the CDC (PLACES and the Environmental Justice Index). Land cover comes from the USGS and EPA. Election-day and lead-up weather come from PRISM 4km daily grids and the NOAA Global Historical Climatology Network. Mail-voting and election-administration patterns come from the MIT Election Lab's Survey of the Performance of American Elections. Block-group crime detail comes from CrimeGrade. Internet data and modeling support provided by ISPreports.org.
Modeling and analysis by the BestNeighborhood data science team. Full methodology and findings: political spectrum map.
Methodology reviewed by the BestNeighborhood data team. Last updated May 2026.