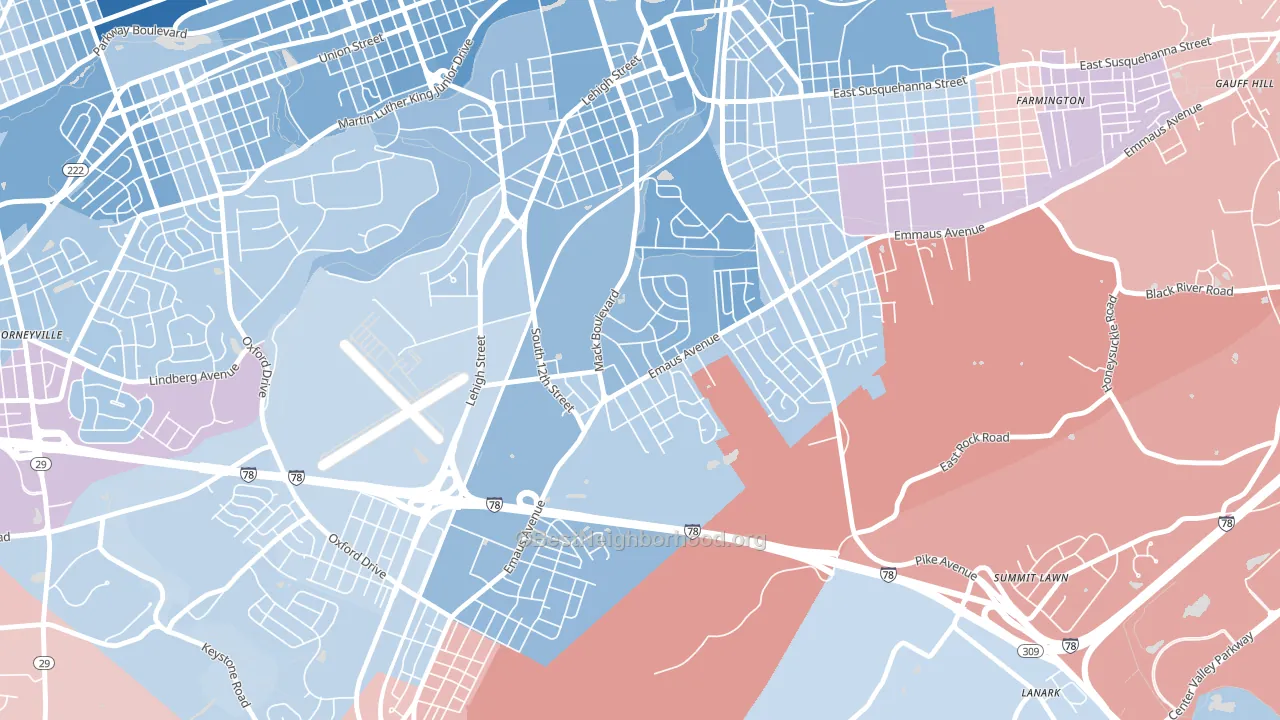
South Poplar leans Democratic by roughly 16 points: about 58% of voters vote Democratic and 42% Republican.
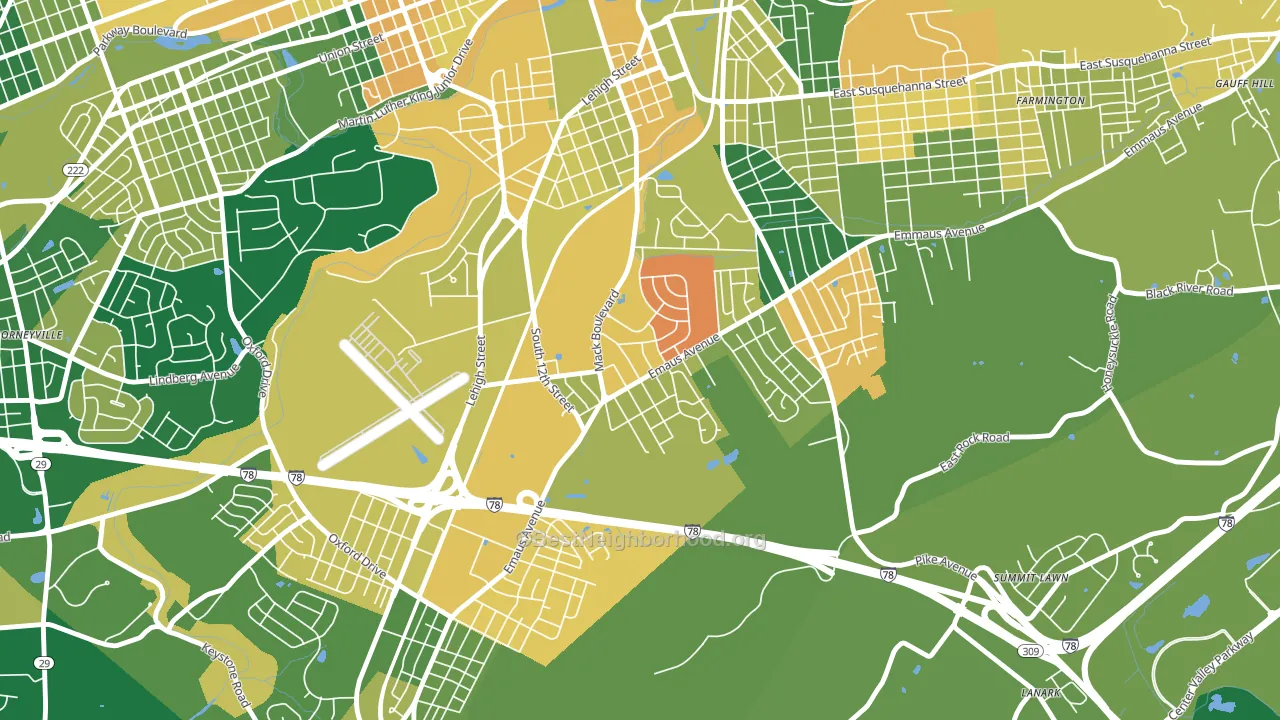
About 48% of adults in South Poplar typically vote, below the U.S. average of about 62%. Among adults in South Poplar, ~28% vote Democratic, ~20% Republican, and ~52% don't vote. The map below shows estimated turnout by block group.
How South Poplar compares
Among neighborhoods within 5 miles, South Poplar leans more Democratic than 4 of 15 neighbors.
South Poplar runs about 19 points more Democratic than Pennsylvania as a whole. Pennsylvania is roughly evenly split, and South Poplar sits clearly on the Democratic side.
Why South Poplar leans the way it does
This analysis examined 14,881 data points per neighborhood to find what predicts political lean and turnout. The items below are a few correlations that stood out for South Poplar, not a ranked or complete list of what matters most.
South Poplar votes against the grain of Pennsylvania. Pennsylvania is roughly evenly split, while South Poplar runs about 19 points more Democratic.
Homeownership and voter turnout
Places with renter-heavy households tend to turn out at a lower rate; South Poplar, Allentown, PA sits in the bottom quarter nationally on this measure.
Why turnout in South Poplar looks the way it does
Renters vote less often than owners. About 68% of households in South Poplar rent, about 43 points above the U.S. average of 25%. Low high-school completion lines up with lower turnout, and about 80% of adults in South Poplar have completed high school, below 85% of neighborhoods. Learn more about the findings and methodology on the political spectrum map.
Nearby Neighborhoods
- salisbury, Allentown, PA R+2
- Mountainville, Allentown, PA D+12
- Fairview, Allentown, PA D+23
- West Walnut, Allentown, PA D+30
- Downtown, Allentown, PA D+38
- Old Allentown, Allentown, PA D+34
- West Park, Allentown, PA D+29
- 1st Ward, Allentown, PA D+30
- Jordan Heights, Allentown, PA D+36
- Eighth Ward, Allentown, PA D+26
Neighborhoods with Similar Populations
- Spring Park, Jacksonville, FL D+15
- Oldtown, Baltimore, MD D+77
- Fairmount, Eugene, OR D+73
- Legacy Place, Alafaya, FL D+13
- Berea, Baltimore, MD D+87
- Selby-on-the-Bay, Mayo, MD R+13
- Pasadena Bear Creek Estates, St. Petersburg, FL Even
- Burbank, San Jose, CA D+41
- Amber Valley, Fargo, ND D+11
- Boulevard Bluffs, Everett, WA D+17
Sources and methodology
Precinct-level voting records used to fit the model come from Pennsylvania Department of State, Bureau of Elections, distributed by the Voting and Election Science Team. Demographic inputs come from the U.S. Census Bureau (ACS 5-year estimates and the 2020 Decennial Census). Health and environmental inputs come from the CDC (PLACES and the Environmental Justice Index). Land cover comes from the USGS and EPA. Election-day and lead-up weather come from PRISM 4km daily grids and the NOAA Global Historical Climatology Network. Mail-voting and election-administration patterns come from the MIT Election Lab's Survey of the Performance of American Elections. Block-group crime detail comes from CrimeGrade. Internet data and modeling support provided by ISPreports.org.
Modeling and analysis by the BestNeighborhood data science team. Full methodology and findings: political spectrum map.
Methodology reviewed by the BestNeighborhood data team. Last updated May 2026.