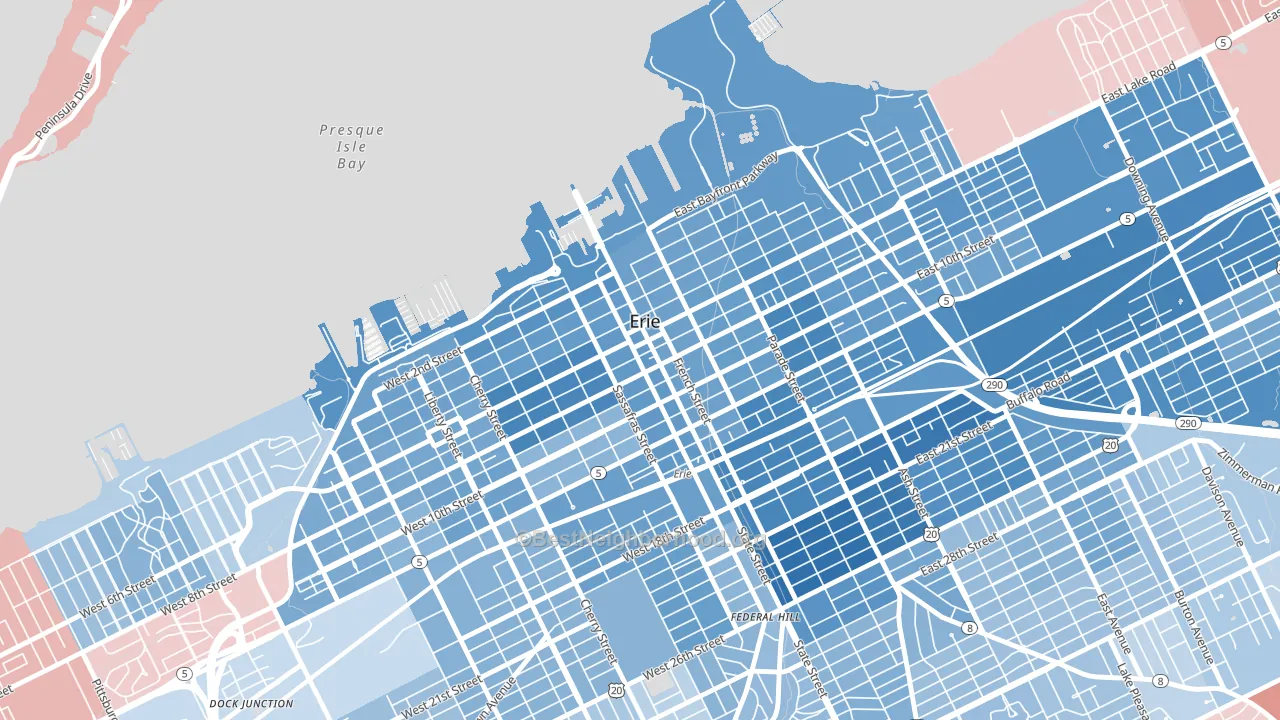
Downtown Erie leans heavily Democratic by roughly 36 points: about 68% of voters vote Democratic and 32% Republican.
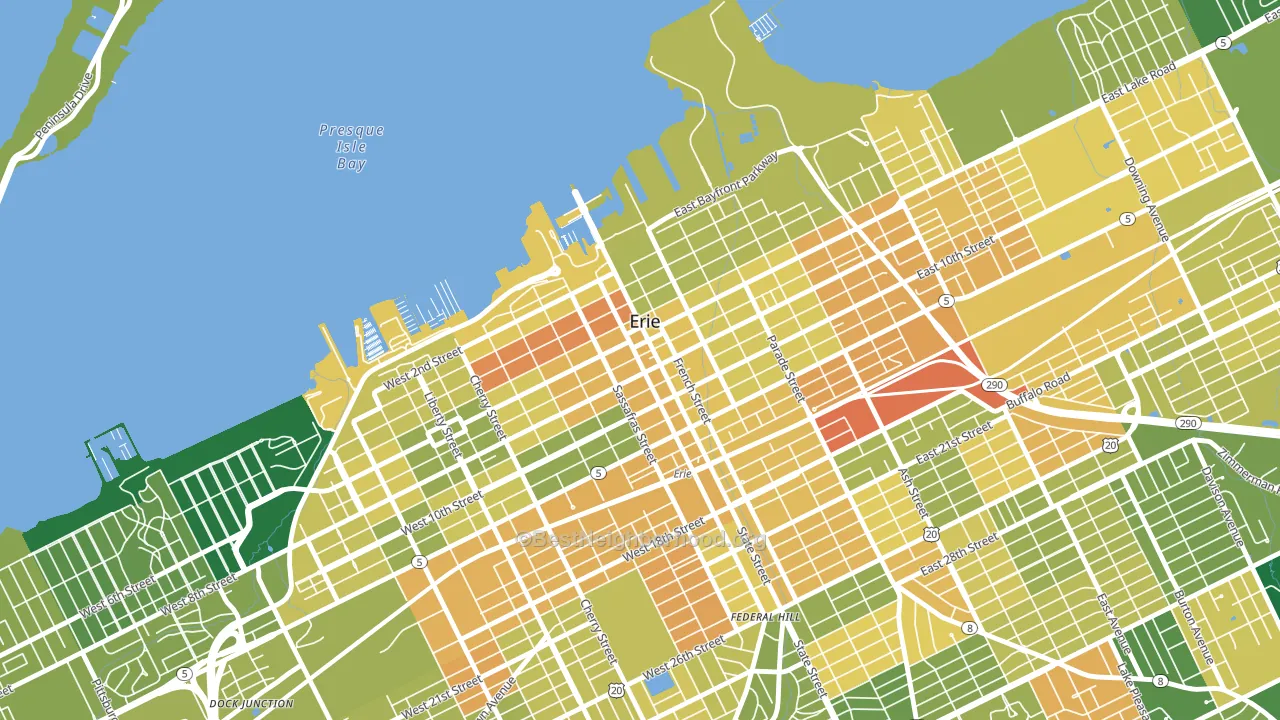
About 46% of adults in Downtown Erie typically vote, below the U.S. average of about 62%. Among adults in Downtown Erie, ~31% vote Democratic, ~15% Republican, and ~54% don't vote. The map below shows estimated turnout by block group.
How Downtown Erie compares
Among neighborhoods within 5 miles, Downtown Erie leans more Democratic than 10 of 12 neighbors.
Downtown Erie runs about 37 points more Democratic than Pennsylvania as a whole. Pennsylvania is roughly evenly split, and Downtown Erie sits clearly on the Democratic side.
Politics vary noticeably by block within Downtown Erie. The west side is the most Democratic-leaning (D+48) and the east side is the least Democratic-leaning (D+27), a spread of about 21 points.
Why Downtown Erie leans the way it does
This analysis examined 14,881 data points per neighborhood to find what predicts political lean and turnout. The items below are a few correlations that stood out for Downtown Erie, not a ranked or complete list of what matters most.
Downtown Erie votes against the grain of Pennsylvania. Pennsylvania is roughly evenly split, while Downtown Erie runs about 37 points more Democratic. A high never-married share predicts Democratic voting, and about 59% of adults in Downtown Erie have never been married, above 93% of neighborhoods.
Walkability and Democratic lean
Places with a highly walkable street grid tend to lean Democratic; Downtown Erie, Erie, PA sits in the top tenth nationally on this measure. A walkable street grid does not change how people vote; it mostly reflects how urban a place is.
Why turnout in Downtown Erie looks the way it does
Renters vote less often than owners. About 92% of households in Downtown Erie rent, about 67 points above the U.S. average of 25%. High-crime urban areas turn out at lower rates, and Downtown Erie sits in the top 15% on a violent-crime measure. Learn more about the findings and methodology on the political spectrum map.
Nearby Neighborhoods
- East Erie, Erie, PA D+47
- Little Italy, Erie, PA D+30
- Bayfront, Erie, PA D+34
- Central Eastside, Erie, PA D+44
- West Side Squires, Erie, PA D+23
- Marvintown, Erie, PA D+27
- Southeast Erie, Erie, PA D+20
- South East Hills, Erie, PA D+16
- Robbins Blass, Erie, PA D+9
- Belle Valley, Erie, PA R+4
Neighborhoods with Similar Populations
- Starview, Redding, CA R+27
- Lakeview Terrace, Kansas City, MO D+14
- Heritage District, Gilbert, AZ D+5
- Hillsmere Shores, Annapolis Neck, MD D+19
- SR Marmon, Albuquerque, NM D+13
- Downtown Pomona, Pomona, CA D+36
- Arnold Heights, Lincoln, NE R+5
- Clanton Park-Roseland, Charlotte, NC D+83
- Westfield, Baltimore, MD D+66
- Bellalago, Kissimmee, FL D+9
Sources and methodology
Precinct-level voting records used to fit the model come from Pennsylvania Department of State, Bureau of Elections, distributed by the Voting and Election Science Team. Demographic inputs come from the U.S. Census Bureau (ACS 5-year estimates and the 2020 Decennial Census). Health and environmental inputs come from the CDC (PLACES and the Environmental Justice Index). Land cover comes from the USGS and EPA. Election-day and lead-up weather come from PRISM 4km daily grids and the NOAA Global Historical Climatology Network. Mail-voting and election-administration patterns come from the MIT Election Lab's Survey of the Performance of American Elections. Block-group crime detail comes from CrimeGrade. Internet data and modeling support provided by ISPreports.org.
Modeling and analysis by the BestNeighborhood data science team. Full methodology and findings: political spectrum map.
Methodology reviewed by the BestNeighborhood data team. Last updated May 2026.