Tonto Basin is a Republican stronghold. About 21% of voters here vote Democratic and 79% Republican.
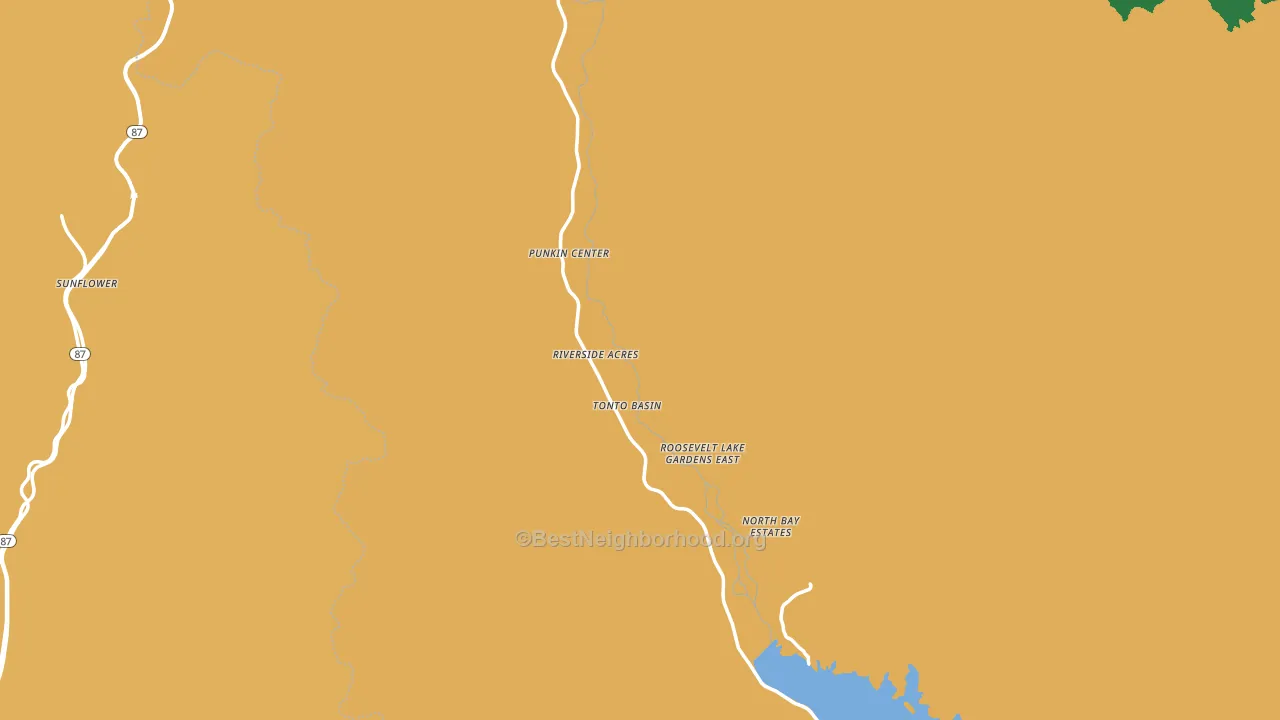
About 46% of adults in Tonto Basin typically vote, below the U.S. average of about 62%. Among adults in Tonto Basin, ~10% vote Democratic, ~36% Republican, and ~54% don't vote. The map below shows estimated turnout by block group.
How Tonto Basin compares
Among cities within 25 miles, Tonto Basin is the most Republican-leaning.
Tonto Basin runs about 53 points more Republican than Arizona as a whole.
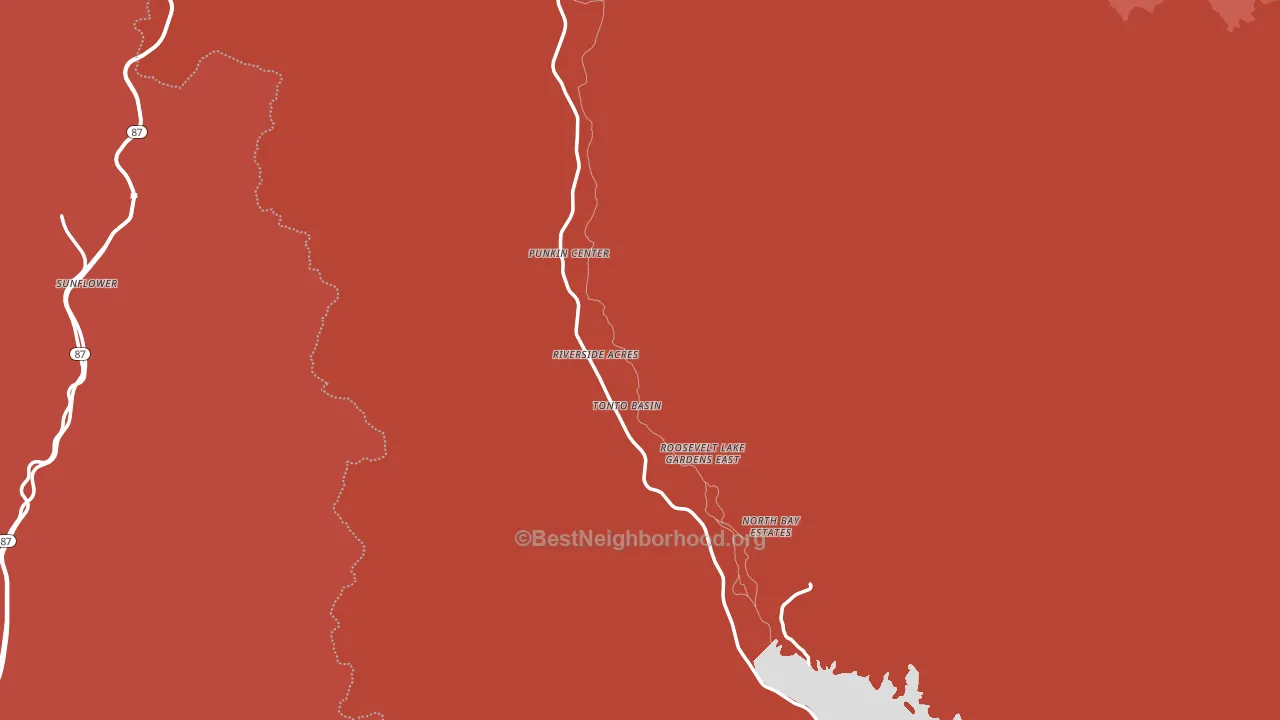
Politics vary noticeably by neighborhood within Tonto Basin. The southeast side is the most Republican-leaning (R+59) and the northwest side is the least Republican-leaning (R+44), a spread of about 15 points.
Why Tonto Basin leans the way it does
This analysis examined 14,881 data points per city to find what predicts political lean and turnout. The items below are a few correlations that stood out for Tonto Basin, not a ranked or complete list of what matters most.
Rural areas vote Republican. Fewer than 1% of residents in Tonto Basin live in densely developed areas, about 38 points below the Arizona average of 39%.
Population density and Republican lean
Places with low population density tend to lean Republican; Tonto Basin, AZ sits in the bottom tenth nationally on this measure.
Why turnout in Tonto Basin looks the way it does
High-crime urban areas turn out at lower rates, mostly because the housing stress common in those areas makes voting harder. Tonto Basin sits in the top 15% nationally on a violent-crime measure. See CrimeGrade for more details. Learn more about the findings and methodology on the political spectrum map.
Nearby Cities
- Jakes Corner, AZ R+57
- Rye, AZ R+50
- Roosevelt, AZ R+40
- Rio Verde, AZ R+26
- Alchesay Flat, AZ D+6
- Young, AZ R+58
- Fort McDowell, AZ D+43
- Payson, AZ R+42
- Goldfield, AZ R+47
- Star Valley, AZ R+53
Cities with Similar Populations
- Ashley, IN R+55
- Rangeley, ME R+4
- Elm Creek, NE R+63
- New Ulm, TX R+69
- Kingsford Heights, IN R+22
- Tripoli, IA R+41
- Villa Nova, OH R+56
- Alstead, NH R+20
- Oak Leaf, TX R+14
- May, TX R+72
Sources and methodology
Precinct-level voting records used to fit the model come from Arizona Secretary of State, Elections, distributed by the Voting and Election Science Team. Demographic inputs come from the U.S. Census Bureau (ACS 5-year estimates and the 2020 Decennial Census). Health and environmental inputs come from the CDC (PLACES and the Environmental Justice Index). Land cover comes from the USGS and EPA. Election-day and lead-up weather come from PRISM 4km daily grids and the NOAA Global Historical Climatology Network. Mail-voting and election-administration patterns come from the MIT Election Lab's Survey of the Performance of American Elections. Block-group crime detail comes from CrimeGrade. Internet data and modeling support provided by ISPreports.org.
Modeling and analysis by the BestNeighborhood data science team. Full methodology and findings: political spectrum map.
Methodology reviewed by the BestNeighborhood data team. Last updated May 2026.