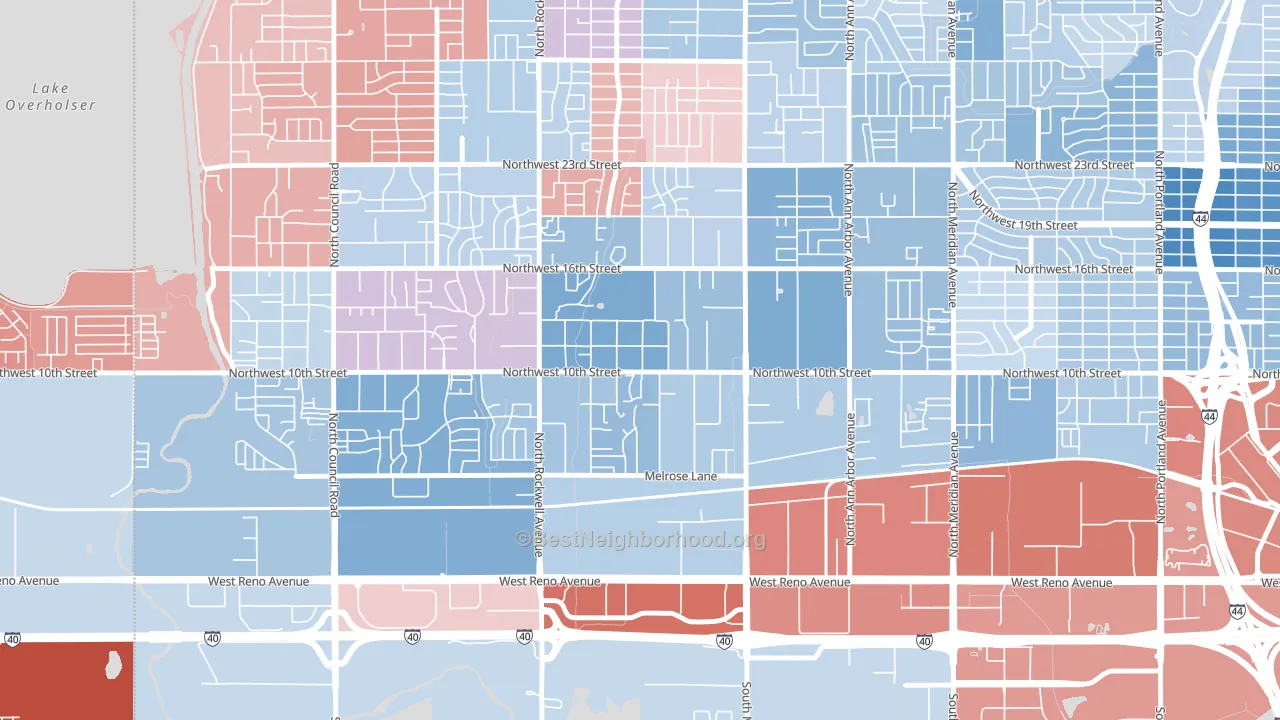
West 10th leans Democratic by roughly 20 points: about 60% of voters vote Democratic and 40% Republican.
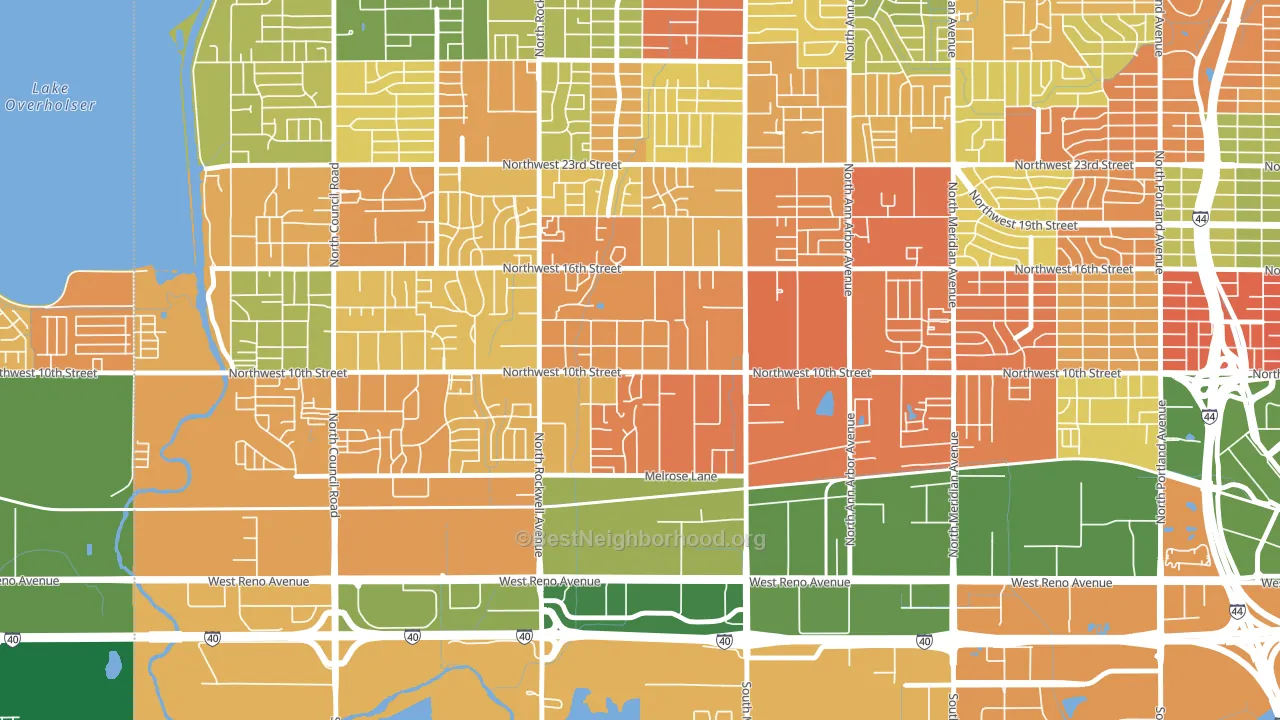
About 26% of adults in West 10th typically vote, below the U.S. average of about 62%. Among adults in West 10th, ~16% vote Democratic, ~10% Republican, and ~74% don't vote. The map below shows estimated turnout by block group.
How West 10th compares
West 10th runs about 68 points more Democratic than Oklahoma as a whole. Oklahoma leans Republican overall, while West 10th is one of the few Democratic-leaning pockets.
Why West 10th leans the way it does
This analysis examined 14,881 data points per neighborhood to find what predicts political lean and turnout. The items below are a few correlations that stood out for West 10th, not a ranked or complete list of what matters most.
West 10th votes against the grain of Oklahoma. Oklahoma leans Republican overall, while West 10th runs about 68 points more Democratic.
High-school completion, developed land, and voter turnout
Places that combine low high-school-completion share and a heavily developed built environment tend to turn out at a lower rate, as West 10th, Oklahoma City, OK does.
Why turnout in West 10th looks the way it does
Areas with limited routine healthcare access turn out at lower rates. West 10th is in the bottom quarter nationally for routine-care measures such as insurance coverage, preventive screenings, and dental visits. The dental-visit rate here is about 42%, about 13 points below the Oklahoma average of 55%. Renters vote less often than owners, and about 73% of households in West 10th rent, compared to around 57% in nearby neighborhoods. High food insecurity lines up with lower turnout, and about 41% of adults in West 10th report food insecurity, above 94% of neighborhoods. Learn more about the findings and methodology on the political spectrum map.
Nearby Neighborhoods
- Rockwood, Oklahoma City, OK D+15
- Midtown, Oklahoma City, OK D+40
- Capitol Hill, Oklahoma City, OK D+23
- South Walker, Oklahoma City, OK D+10
- Brandywine, Oklahoma City, OK R+26
- Parkview, Oklahoma City, OK D+25
- Brookhaven, Norman, OK Even
- Charles Page, Tulsa, OK R+12
- Kensington, Tulsa, OK D+21
- South Peoria, Tulsa, OK D+28
Neighborhoods with Similar Populations
- Lake Houston, Houston, TX R+15
- Fort Caroline Shores, Jacksonville, FL R+29
- Fairmont, Pacifica, CA D+38
- Bear Canyon, Tucson, AZ R+4
- Mallory Creek at Abacoa, Jupiter, FL R+11
- Platte Brook North, Kansas City, MO D+9
- Caballo Hills, Oakland, CA D+66
- Carson Corner, Tucson, AZ D+5
- South Coast, Santa Ana, CA D+24
- Prince Tucson, Tucson, AZ D+36
Sources and methodology
Precinct-level voting records used to fit the model come from Oklahoma State Election Board, distributed by the Voting and Election Science Team. Demographic inputs come from the U.S. Census Bureau (ACS 5-year estimates and the 2020 Decennial Census). Health and environmental inputs come from the CDC (PLACES and the Environmental Justice Index). Land cover comes from the USGS and EPA. Election-day and lead-up weather come from PRISM 4km daily grids and the NOAA Global Historical Climatology Network. Mail-voting and election-administration patterns come from the MIT Election Lab's Survey of the Performance of American Elections. Block-group crime detail comes from CrimeGrade. Internet data and modeling support provided by ISPreports.org.
Modeling and analysis by the BestNeighborhood data science team. Full methodology and findings: political spectrum map.
Methodology reviewed by the BestNeighborhood data team. Last updated May 2026.