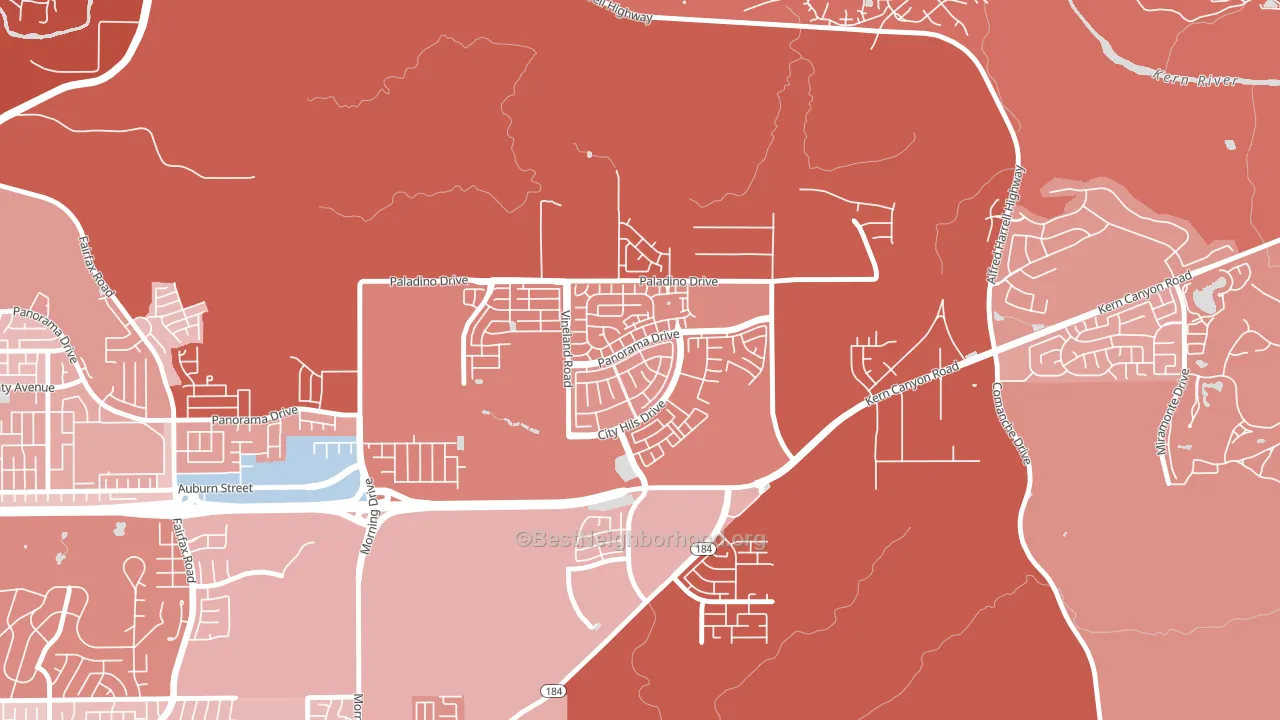
City in the Hills leans Republican by roughly 22 points: about 39% of voters vote Democratic and 61% Republican.
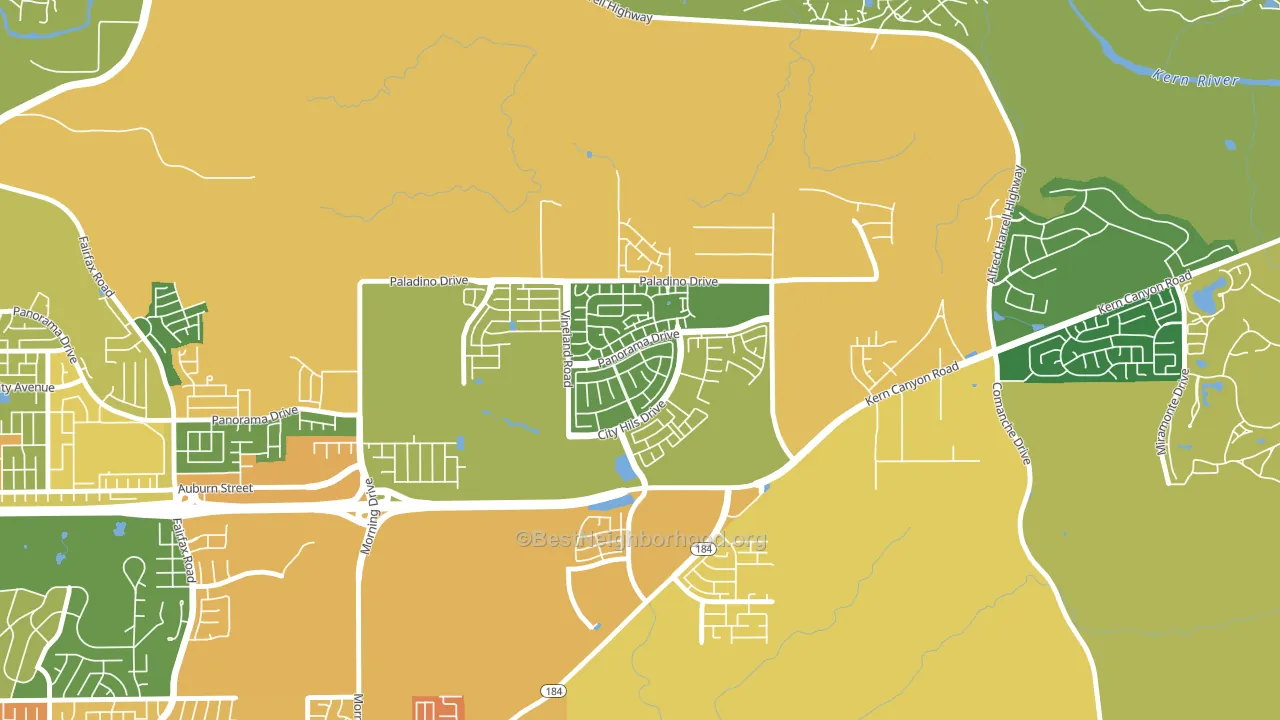
About 77% of adults in City in the Hills typically vote, above the U.S. average of about 62%. Among adults in City in the Hills, ~30% vote Democratic, ~47% Republican, and ~23% don't vote. The map below shows estimated turnout by block group.
How City in the Hills compares
Among neighborhoods within 5 miles, City in the Hills is the most Republican-leaning.
City in the Hills runs about 43 points more Republican than California as a whole. California leans Democratic overall, while City in the Hills is one of the few Republican-leaning pockets.
Why City in the Hills leans the way it does
This analysis examined 14,881 data points per neighborhood to find what predicts political lean and turnout. The items below are a few correlations that stood out for City in the Hills, not a ranked or complete list of what matters most.
City in the Hills votes against the grain of California. California leans Democratic overall, while City in the Hills runs about 43 points more Republican. A high family-household share predicts Republican voting, and about 87% of households in City in the Hills are family households, above 95% of neighborhoods.
Preventive-care access and voter turnout
Places with strong routine preventive-care access tend to turn out at a higher rate; City in the Hills, Bakersfield, CA sits in the top quarter nationally on this measure. Dental visits do not drive turnout; the rate reflects income, insurance, and healthcare access, which line up with who votes.
Why turnout in City in the Hills looks the way it does
Areas with strong routine healthcare access turn out at higher rates. City in the Hills is in the top quarter nationally for routine-care measures such as insurance coverage, preventive screenings, and dental visits. The dental-visit rate here is about 74%, about 14 points above the U.S. average of 60%. Homeowners vote more often than renters, and about 98% of households in City in the Hills own their home, compared to around 45% in nearby neighborhoods. Learn more about the findings and methodology on the political spectrum map.
Nearby Neighborhoods
- Bakersfield Country Club, Bakersfield, CA R+12
- Hillcrest-Bakersfield, Bakersfield, CA R+2
- Oakridge, Bakersfield, CA D+11
- Tyner Homes, Bakersfield, CA D+5
- East Bakersfield, Bakersfield, CA D+19
- College Heights Baker Street, Bakersfield, CA D+15
- La Cresta-Alta Vista, Bakersfield, CA R+14
- Lakeview-Bakersfield, Bakersfield, CA D+25
- Homaker Park, Bakersfield, CA D+13
- Casa Loma, Bakersfield, CA D+20
Neighborhoods with Similar Populations
- Deercreek, Jacksonville, FL R+16
- Evergreen Meadows, Evergreen, CO D+16
- Old Town, Beaumont, TX D+32
- Conant Gardens, Detroit, MI D+86
- Mission Lake, Kansas City, MO D+14
- Hill Farms-University Neighborh, Madison, WI D+81
- Calton Gardens, Laredo, TX D+9
- Agua Dulce, El Paso, TX D+8
- Western Washington University, Bellingham, WA D+73
- Poncey-Highland, Atlanta, GA D+67
Sources and methodology
Precinct-level voting records used to fit the model come from California Secretary of State, Elections, distributed by the Voting and Election Science Team. Demographic inputs come from the U.S. Census Bureau (ACS 5-year estimates and the 2020 Decennial Census). Health and environmental inputs come from the CDC (PLACES and the Environmental Justice Index). Land cover comes from the USGS and EPA. Election-day and lead-up weather come from PRISM 4km daily grids and the NOAA Global Historical Climatology Network. Mail-voting and election-administration patterns come from the MIT Election Lab's Survey of the Performance of American Elections. Block-group crime detail comes from CrimeGrade. Internet data and modeling support provided by ISPreports.org.
Modeling and analysis by the BestNeighborhood data science team. Full methodology and findings: political spectrum map.
Methodology reviewed by the BestNeighborhood data team. Last updated May 2026.