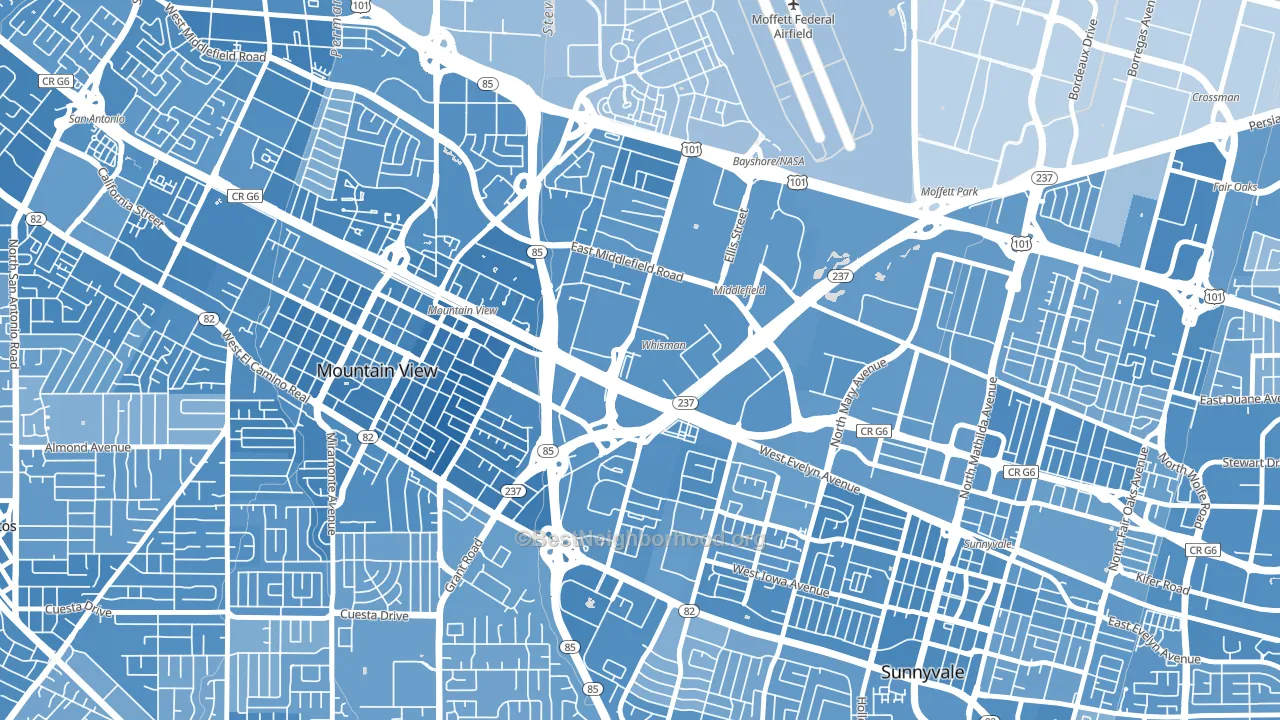
Whisman Station leans heavily Democratic by roughly 46 points: about 73% of voters vote Democratic and 27% Republican.
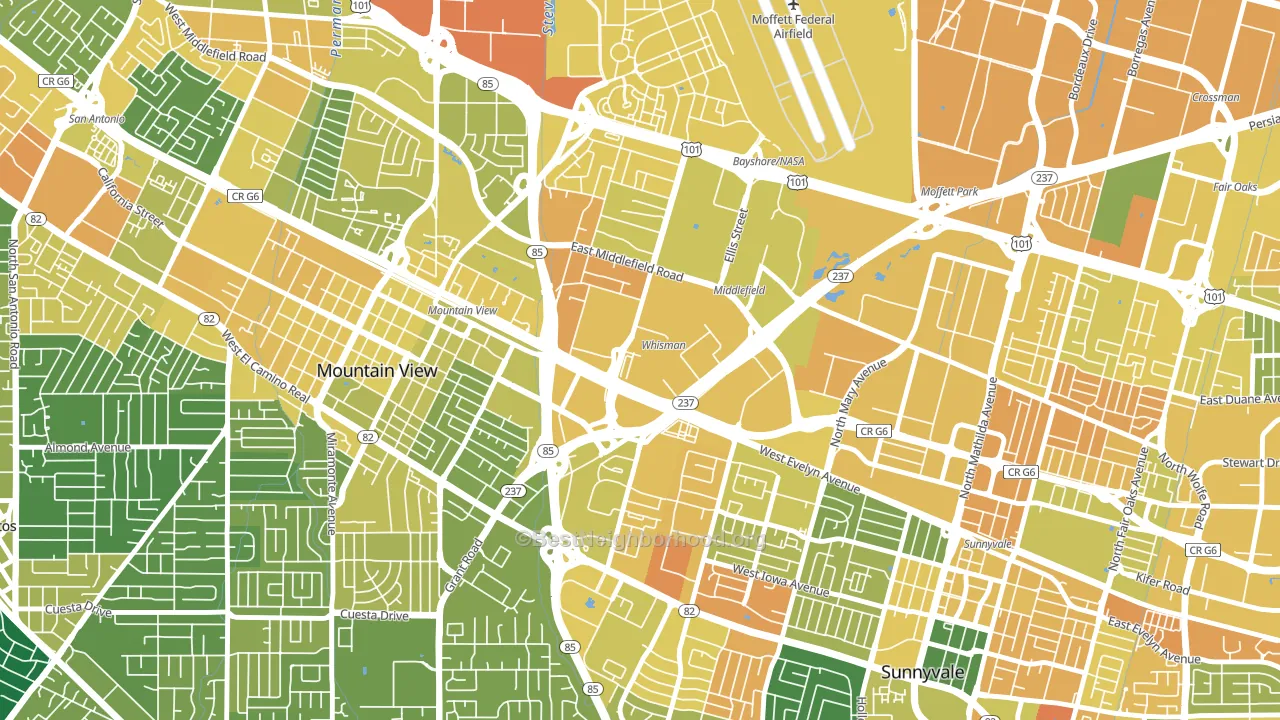
About 51% of adults in Whisman Station typically vote, below the U.S. average of about 62%. Among adults in Whisman Station, ~37% vote Democratic, ~14% Republican, and ~49% don't vote. The map below shows estimated turnout by block group.
How Whisman Station compares
Among neighborhoods within 5 miles, Whisman Station leans more Democratic than 16 of 21 neighbors.
Whisman Station runs about 25 points more Democratic than California as a whole.
Politics vary noticeably by block within Whisman Station. The east side is the most Democratic-leaning (D+48) and the southwest side is the least Democratic-leaning (D+35), a spread of about 13 points.
Why Whisman Station leans the way it does
This analysis examined 14,881 data points per neighborhood to find what predicts political lean and turnout. The items below are a few correlations that stood out for Whisman Station, not a ranked or complete list of what matters most.
Areas with high college attainment vote Democratic. About 77% of adults in Whisman Station hold a bachelor's degree, about 49 points above the U.S. average of 28%. Dense areas vote Democratic, and Whisman Station sits in the top fifth on density (more than 99%, above 89% of neighborhoods).
Walkability and Democratic lean
Places with a highly walkable street grid tend to lean Democratic; Whisman Station, Mountain View, CA sits in the top tenth nationally on this measure. A walkable street grid does not change how people vote; it mostly reflects how urban a place is.
Why turnout in Whisman Station looks the way it does
Crowded housing lines up with lower turnout. About 10% of homes in Whisman Station have more than one occupant per room, above 91% of neighborhoods. Strong routine healthcare access lines up with higher turnout, and Whisman Station sits in the top quarter on routine-care measures. Renters vote less often than owners, and about 61% of households in Whisman Station rent, about 36 points above the U.S. average of 25%. Learn more about the findings and methodology on the political spectrum map.
Nearby Neighborhoods
- North Whisman, Mountain View, CA D+39
- Old Mountain View, Mountain View, CA D+60
- Jackson Park, Mountain View, CA D+53
- Martens-Carmelita, Mountain View, CA D+38
- Cuesta Park, Mountain View, CA D+40
- Shoreline West, Mountain View, CA D+54
- Lowlanders, Sunnyvale, CA D+42
- Heritage District, Sunnyvale, CA D+43
- Snail, Sunnyvale, CA D+33
- Sunnyvale West, Sunnyvale, CA D+37
Neighborhoods with Similar Populations
- Old North Sacramento, Sacramento, CA D+39
- Clifton Heights, Louisville, KY D+44
- Creighton Village, Old Bridge, NJ R+24
- Lakeview, Orem, UT R+18
- Chevy Chase, Glendale, CA D+3
- Coronado Hills, Austin, TX D+53
- The Trails, Las Vegas, NV D+9
- Terra Nova, Chula Vista, CA D+14
- Midtown, Tucson, AZ D+33
- Downtown Oakland, Oakland, CA D+66
Sources and methodology
Precinct-level voting records used to fit the model come from California Secretary of State, Elections, distributed by the Voting and Election Science Team. Demographic inputs come from the U.S. Census Bureau (ACS 5-year estimates and the 2020 Decennial Census). Health and environmental inputs come from the CDC (PLACES and the Environmental Justice Index). Land cover comes from the USGS and EPA. Election-day and lead-up weather come from PRISM 4km daily grids and the NOAA Global Historical Climatology Network. Mail-voting and election-administration patterns come from the MIT Election Lab's Survey of the Performance of American Elections. Block-group crime detail comes from CrimeGrade. Internet data and modeling support provided by ISPreports.org.
Modeling and analysis by the BestNeighborhood data science team. Full methodology and findings: political spectrum map.
Methodology reviewed by the BestNeighborhood data team. Last updated May 2026.