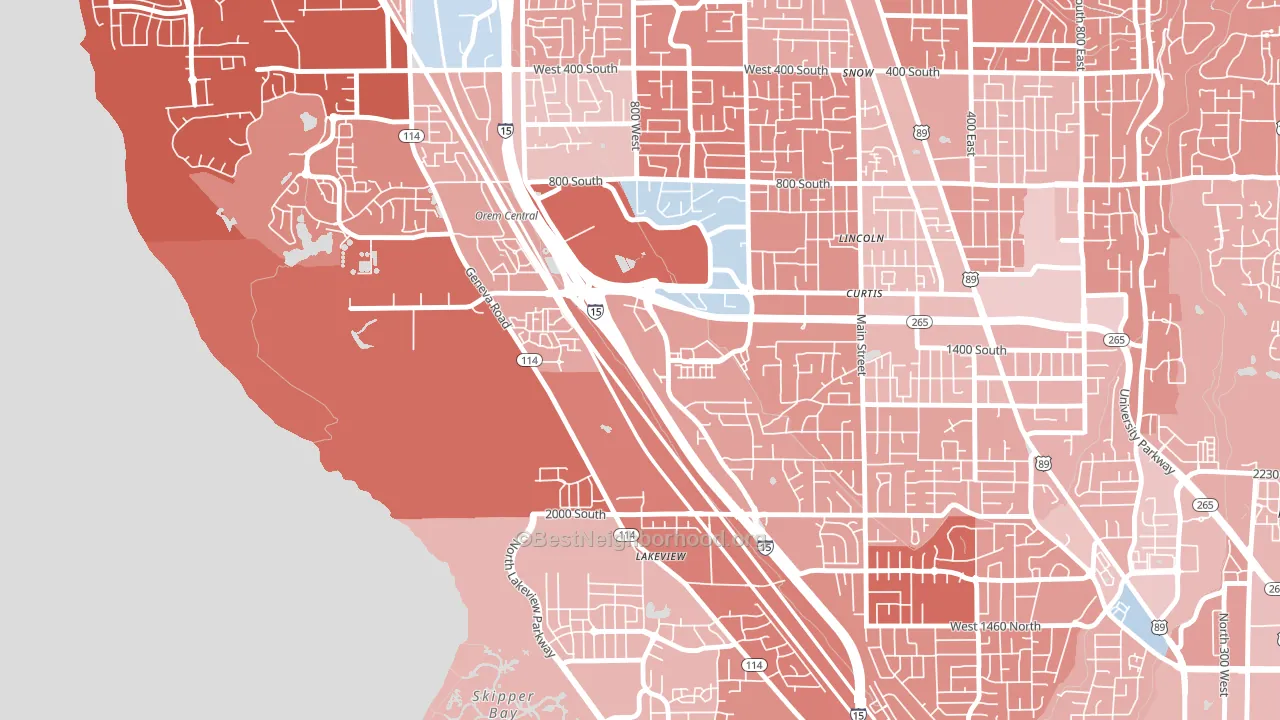
Lakeview leans Republican by roughly 18 points: about 41% of voters vote Democratic and 59% Republican.
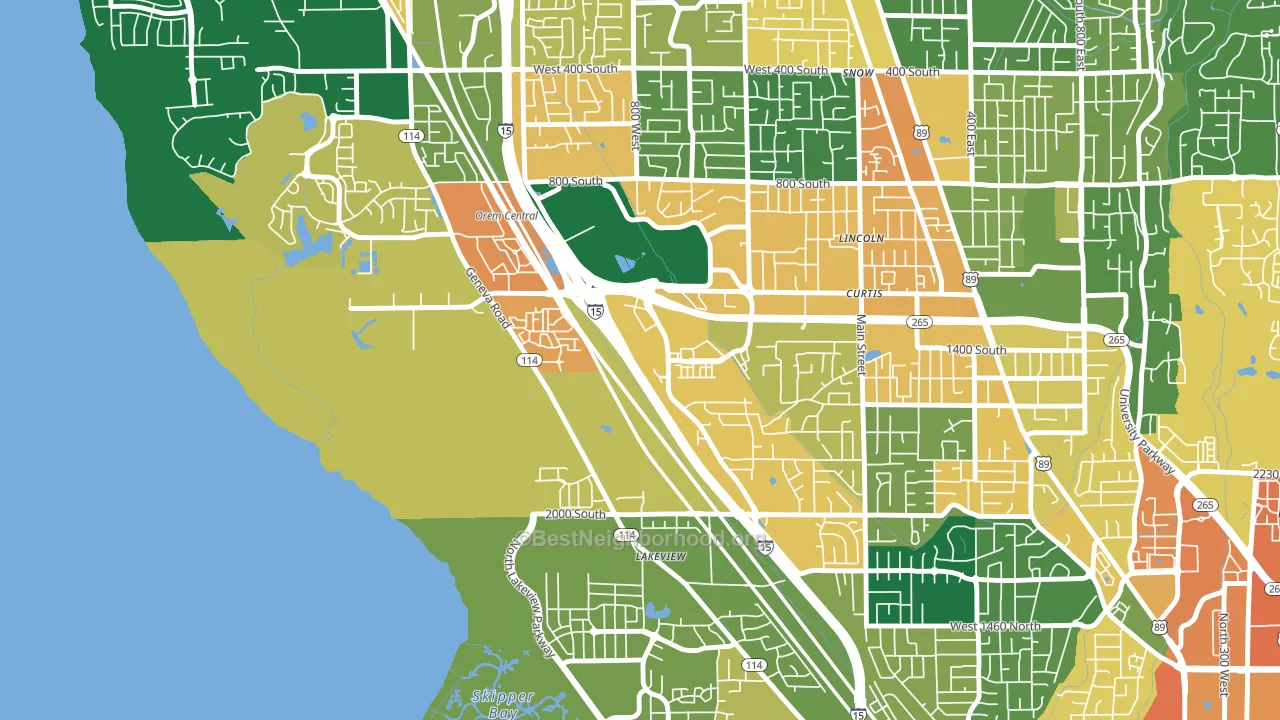
About 38% of adults in Lakeview typically vote, below the U.S. average of about 62%. Among adults in Lakeview, ~16% vote Democratic, ~22% Republican, and ~62% don't vote. The map below shows estimated turnout by block group.
How Lakeview compares
Among neighborhoods within 5 miles, Lakeview leans more Republican than 7 of 15 neighbors.
Politically, Lakeview sits close to the rest of Utah.
Politics vary noticeably by block within Lakeview. The northeast side is the most Republican-leaning (R+25) and the northwest side is the least Republican-leaning (R+12), a spread of about 13 points.
Why Lakeview leans the way it does
Density, race composition, education, and family structure all sit close to their national averages in Lakeview. The lean here lands roughly where demographic data alone would predict.
Population density and Democratic lean
Places with high population density tend to lean Democratic; Lakeview, Orem, UT sits in the top tenth nationally on this measure.
Why turnout in Lakeview looks the way it does
Renters vote less often than owners. About 71% of households in Lakeview rent, about 46 points above the U.S. average of 25%. Learn more about the findings and methodology on the political spectrum map.
Nearby Neighborhoods
- Westmore, Orem, UT R+18
- Sunset Heights, Orem, UT R+26
- Lakeview North, Provo, UT R+24
- Orem North, Orem, UT R+26
- Suncrest, Orem, UT R+18
- Geneva, Orem, UT R+17
- Sharon, Orem, UT R+20
- Dixon, Provo, UT R+14
- Carterville, Provo, UT R+15
- North Park, Provo, UT R+15
Neighborhoods with Similar Populations
- Coronado Hills, Austin, TX D+53
- Whisman Station, Mountain View, CA D+45
- Old North Sacramento, Sacramento, CA D+39
- Clifton Heights, Louisville, KY D+44
- Downtown Oakland, Oakland, CA D+66
- Creighton Village, Old Bridge, NJ R+24
- Chevy Chase, Glendale, CA D+3
- Midtown, Tucson, AZ D+33
- Columbia, Redding, CA R+35
- Terra Nova, Chula Vista, CA D+14
Sources and methodology
Precinct-level voting records used to fit the model come from Utah Lieutenant Governor's Office, Elections, distributed by the Voting and Election Science Team. Demographic inputs come from the U.S. Census Bureau (ACS 5-year estimates and the 2020 Decennial Census). Health and environmental inputs come from the CDC (PLACES and the Environmental Justice Index). Land cover comes from the USGS and EPA. Election-day and lead-up weather come from PRISM 4km daily grids and the NOAA Global Historical Climatology Network. Mail-voting and election-administration patterns come from the MIT Election Lab's Survey of the Performance of American Elections. Block-group crime detail comes from CrimeGrade. Internet data and modeling support provided by ISPreports.org.
Modeling and analysis by the BestNeighborhood data science team. Full methodology and findings: political spectrum map.
Methodology reviewed by the BestNeighborhood data team. Last updated May 2026.