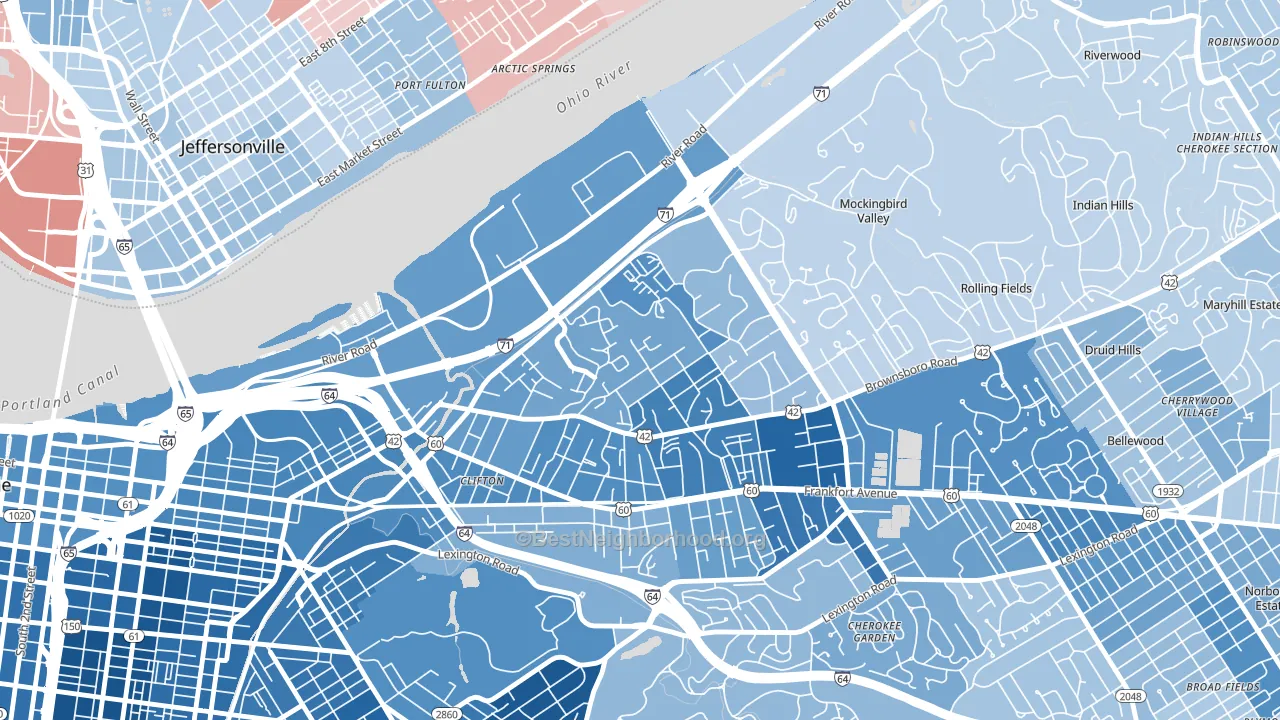
Clifton Heights leans heavily Democratic by roughly 44 points: about 72% of voters vote Democratic and 28% Republican.
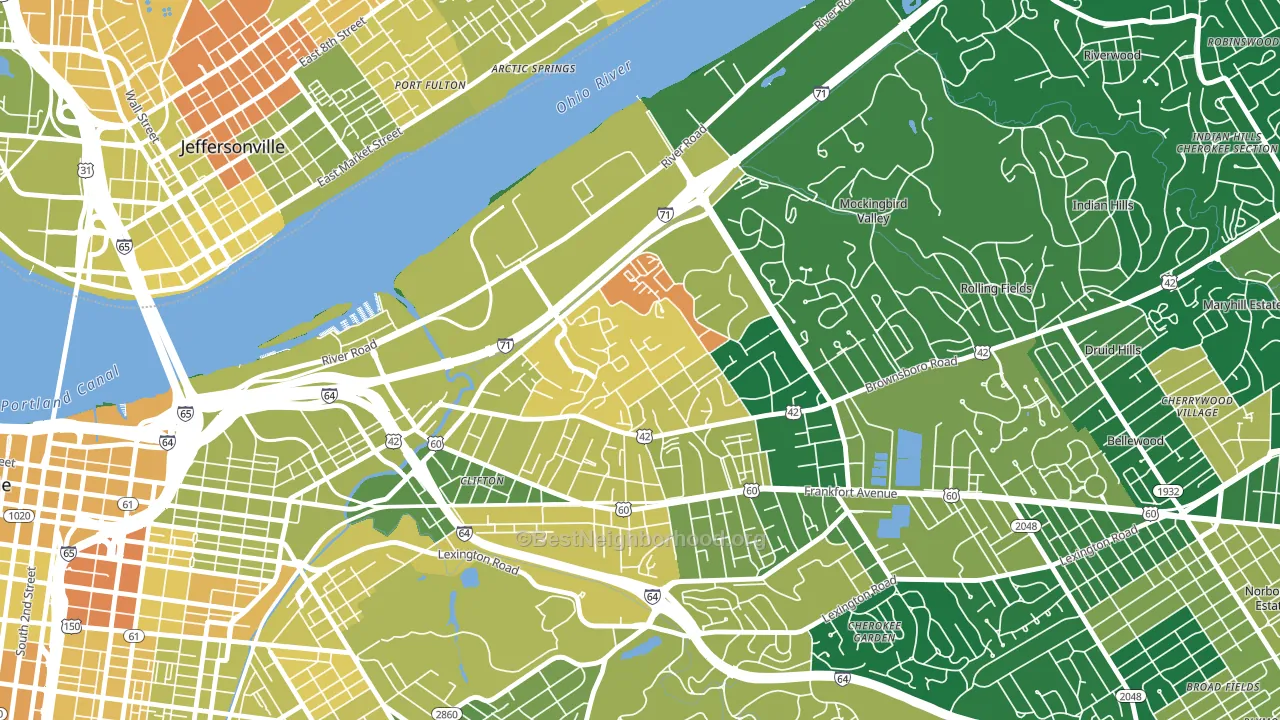
About 48% of adults in Clifton Heights typically vote, below the U.S. average of about 62%. Among adults in Clifton Heights, ~35% vote Democratic, ~13% Republican, and ~52% don't vote. The map below shows estimated turnout by block group.
How Clifton Heights compares
Among neighborhoods within 5 miles, Clifton Heights leans more Democratic than 7 of 21 neighbors.
Clifton Heights runs about 74 points more Democratic than Kentucky as a whole. Kentucky leans Republican overall, while Clifton Heights is one of the few Democratic-leaning pockets.
Why Clifton Heights leans the way it does
This analysis examined 14,881 data points per neighborhood to find what predicts political lean and turnout. The items below are a few correlations that stood out for Clifton Heights, not a ranked or complete list of what matters most.
Clifton Heights votes against the grain of Kentucky. Kentucky leans Republican overall, while Clifton Heights runs about 74 points more Democratic.
Park access and Democratic lean
Places with heavy park coverage tend to lean Democratic; Clifton Heights, Louisville, KY sits in the top quarter nationally on this measure. Park access does not change how people vote; it tends to track denser, higher-income areas.
Why turnout in Clifton Heights looks the way it does
Renters vote less often than owners. About 65% of households in Clifton Heights rent, about 40 points above the U.S. average of 25%. Learn more about the findings and methodology on the political spectrum map.
Nearby Neighborhoods
- Clifton, Louisville, KY D+59
- Crescent Hill, Louisville, KY D+46
- Cherokee Triangle, Louisville, KY D+60
- Phoenix Hill, Louisville, KY D+68
- Rock Creek Lexington Road, Louisville, KY D+35
- Deer Park, Louisville, KY D+61
- Highlands Douglass, Louisville, KY D+57
- Germantown, Louisville, KY D+59
- Belknap, Louisville, KY D+49
- Oak Park, Jeffersonville, IN R+10
Neighborhoods with Similar Populations
- Whisman Station, Mountain View, CA D+45
- Old North Sacramento, Sacramento, CA D+39
- Lakeview, Orem, UT R+18
- Coronado Hills, Austin, TX D+53
- Creighton Village, Old Bridge, NJ R+24
- Chevy Chase, Glendale, CA D+3
- The Trails, Las Vegas, NV D+9
- Terra Nova, Chula Vista, CA D+14
- Midtown, Tucson, AZ D+33
- Riverside Rancho, Glendale, CA D+38
Sources and methodology
Precinct-level voting records used to fit the model come from Kentucky State Board of Elections, distributed by the Voting and Election Science Team. Demographic inputs come from the U.S. Census Bureau (ACS 5-year estimates and the 2020 Decennial Census). Health and environmental inputs come from the CDC (PLACES and the Environmental Justice Index). Land cover comes from the USGS and EPA. Election-day and lead-up weather come from PRISM 4km daily grids and the NOAA Global Historical Climatology Network. Mail-voting and election-administration patterns come from the MIT Election Lab's Survey of the Performance of American Elections. Block-group crime detail comes from CrimeGrade. Internet data and modeling support provided by ISPreports.org.
Modeling and analysis by the BestNeighborhood data science team. Full methodology and findings: political spectrum map.
Methodology reviewed by the BestNeighborhood data team. Last updated May 2026.