
Wilshire Estates-Savannah Mall leans heavily Democratic by roughly 42 points: about 71% of voters vote Democratic and 29% Republican.
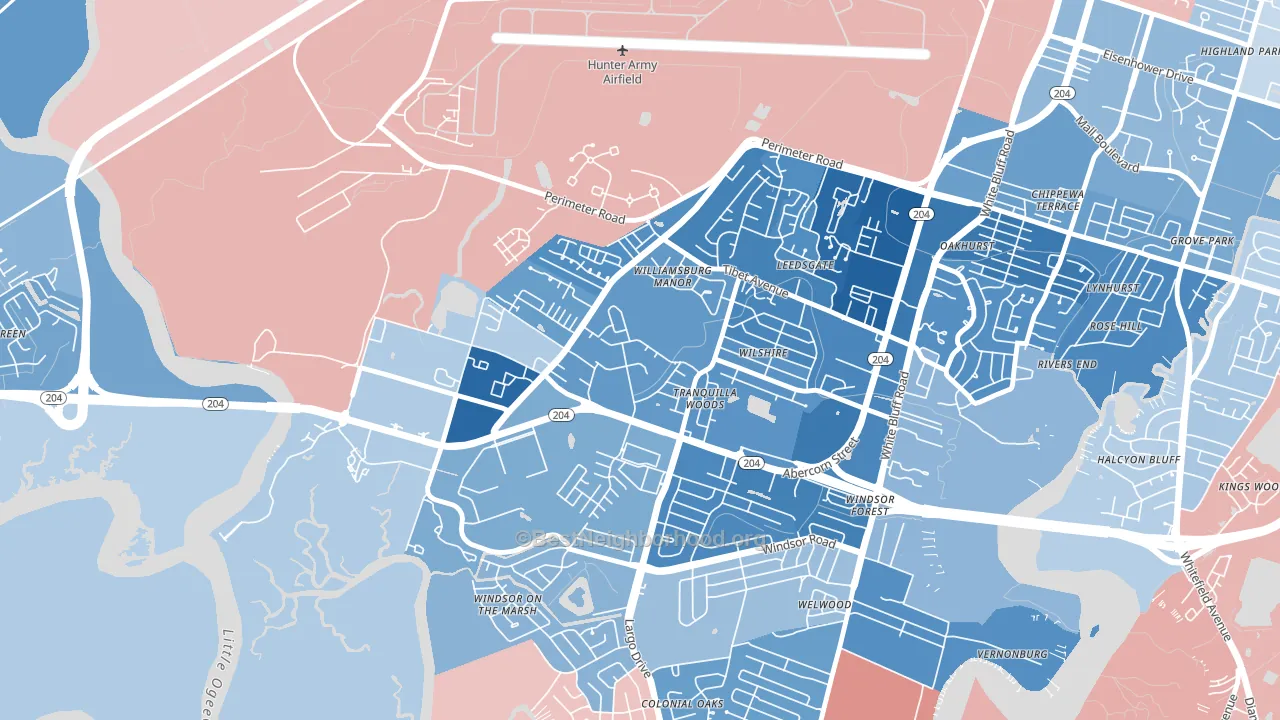
About 54% of adults in Wilshire Estates-Savannah Mall typically vote, below the U.S. average of about 62%. Among adults in Wilshire Estates-Savannah Mall, ~38% vote Democratic, ~16% Republican, and ~46% don't vote. The map below shows estimated turnout by block group.
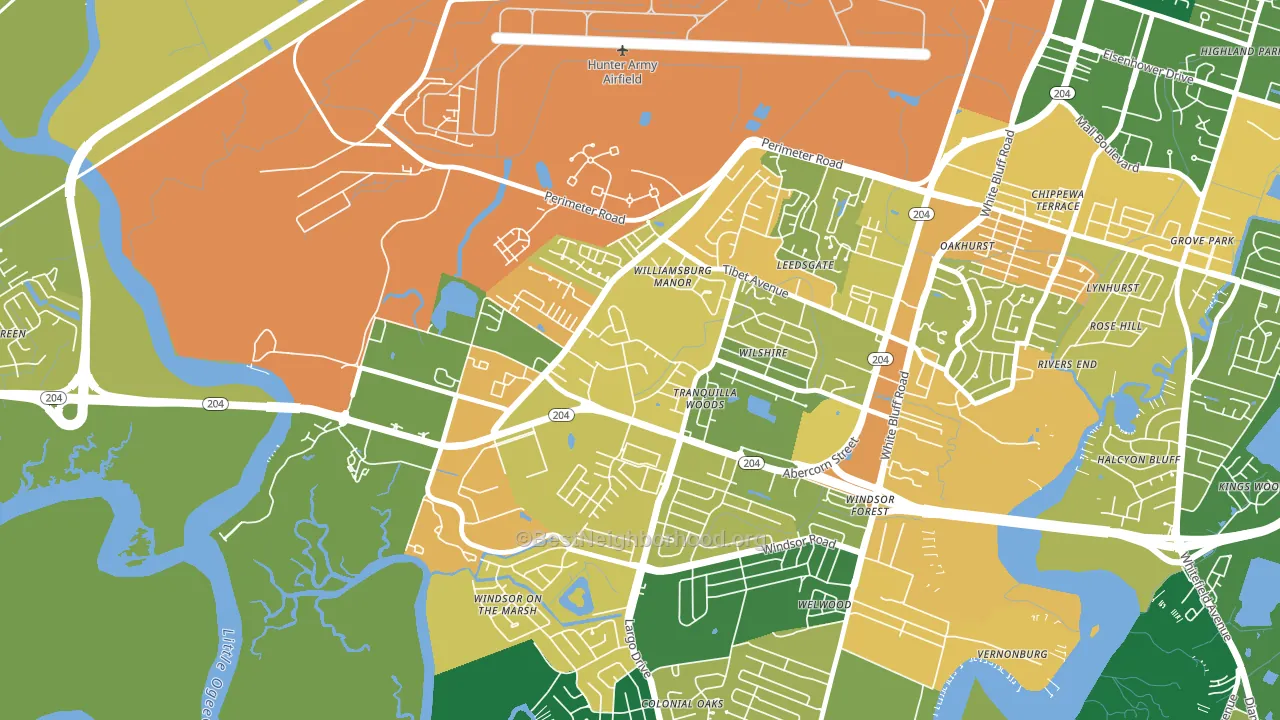
How Wilshire Estates-Savannah Mall compares
Among neighborhoods within 5 miles, Wilshire Estates-Savannah Mall is the most Democratic-leaning.
Wilshire Estates-Savannah Mall runs about 45 points more Democratic than Georgia as a whole. Georgia is roughly evenly split, and Wilshire Estates-Savannah Mall sits clearly on the Democratic side.
Politics vary noticeably by block within Wilshire Estates-Savannah Mall. The west side is the most Democratic-leaning (D+47) and the south side is the least Democratic-leaning (D+35), a spread of about 12 points.
Why Wilshire Estates-Savannah Mall leans the way it does
This analysis examined 14,881 data points per neighborhood to find what predicts political lean and turnout. The items below are a few correlations that stood out for Wilshire Estates-Savannah Mall, not a ranked or complete list of what matters most.
Wilshire Estates-Savannah Mall votes against the grain of Georgia. Georgia is roughly evenly split, while Wilshire Estates-Savannah Mall runs about 45 points more Democratic.
Homeownership and voter turnout
Places with renter-heavy households tend to turn out at a lower rate; Wilshire Estates-Savannah Mall, Savannah, GA sits in the bottom quarter nationally on this measure.
Why turnout in Wilshire Estates-Savannah Mall looks the way it does
Renters vote less often than owners. About 68% of households in Wilshire Estates-Savannah Mall rent, about 43 points above the U.S. average of 25%. Crowded housing lines up with lower turnout, and about 6% of homes in Wilshire Estates-Savannah Mall have more than one occupant per room, above 80% of neighborhoods. Learn more about the findings and methodology on the political spectrum map.
Nearby Neighborhoods
- Windsor Forest, Savannah, GA D+24
- Paradise Park, Savannah, GA D+29
- Hunter Army Airfield, Savannah, GA D+4
- Georgetown, Savannah, GA D+16
- Ardmore-Gould Estates-Olin Heights, Savannah, GA D+36
- Chatham Parkway, Savannah, GA D+42
- Midtown Savannah, Savannah, GA D+71
- Boltons Landing, Charleston, SC D+7
- White Gables, Summerville, SC R+27
- Charleston Historic District, Charleston, SC D+12
Neighborhoods with Similar Populations
- Starin Central, Buffalo, NY D+58
- Olde Providence South, Charlotte, NC D+3
- Webber-Camden, Minneapolis, MN D+61
- Greater Mount Washington, Baltimore, MD D+67
- Brownsfield-Central, Baton Rouge, LA R+7
- Westview, Pacifica, CA D+52
- Downtown Riverfront-190th, Bothell, WA D+42
- Windsor Village North, Santa Ana, CA D+24
- Camino Lago, Phoenix, AZ R+27
- Greater Belhaven, Jackson, MS D+34
Sources and methodology
Precinct-level voting records used to fit the model come from Georgia Elections Division, distributed by the Voting and Election Science Team. Demographic inputs come from the U.S. Census Bureau (ACS 5-year estimates and the 2020 Decennial Census). Health and environmental inputs come from the CDC (PLACES and the Environmental Justice Index). Land cover comes from the USGS and EPA. Election-day and lead-up weather come from PRISM 4km daily grids and the NOAA Global Historical Climatology Network. Mail-voting and election-administration patterns come from the MIT Election Lab's Survey of the Performance of American Elections. Block-group crime detail comes from CrimeGrade. Internet data and modeling support provided by ISPreports.org.
Modeling and analysis by the BestNeighborhood data science team. Full methodology and findings: political spectrum map.
Methodology reviewed by the BestNeighborhood data team. Last updated May 2026.