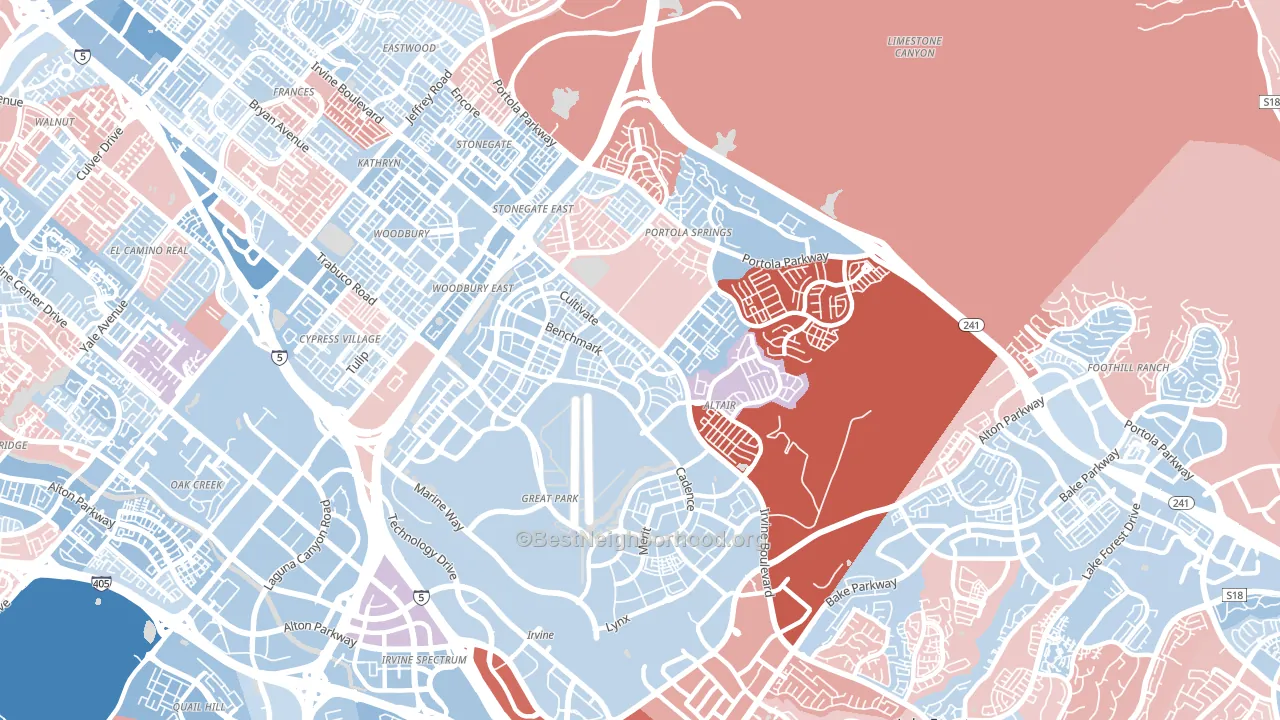
El Toro Marine Air Station leans Democratic by roughly 18 points: about 59% of voters vote Democratic and 41% Republican.
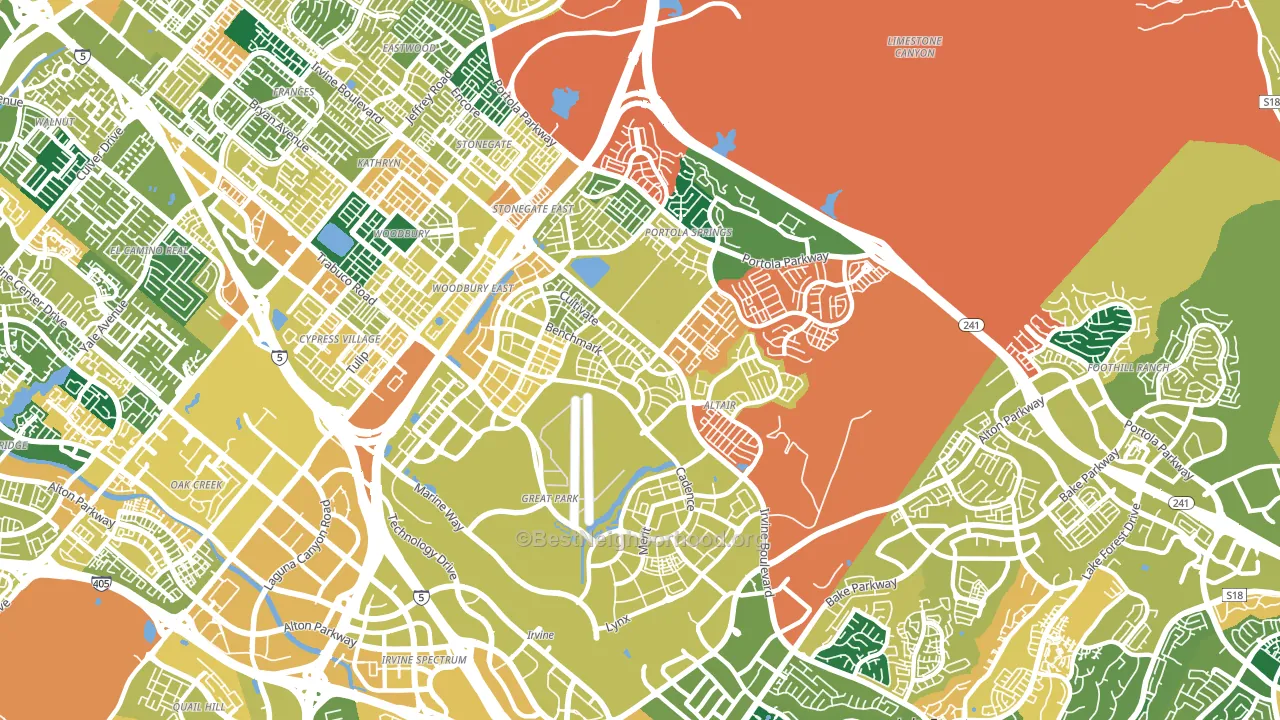
About 51% of adults in El Toro Marine Air Station typically vote, below the U.S. average of about 62%. Among adults in El Toro Marine Air Station, ~30% vote Democratic, ~21% Republican, and ~49% don't vote. The map below shows estimated turnout by block group.
How El Toro Marine Air Station compares
Among neighborhoods within 5 miles, El Toro Marine Air Station leans more Democratic than 12 of 14 neighbors.
Politically, El Toro Marine Air Station sits close to the rest of California.
Politics vary noticeably by block within El Toro Marine Air Station. The northwest side is the most Democratic-leaning (D+23) and the southeast side is the least Democratic-leaning (D+10), a spread of about 13 points.
Why El Toro Marine Air Station leans the way it does
This analysis examined 14,881 data points per neighborhood to find what predicts political lean and turnout. The items below are a few correlations that stood out for El Toro Marine Air Station, not a ranked or complete list of what matters most.
Areas with high college attainment vote Democratic. About 72% of adults in El Toro Marine Air Station hold a bachelor's degree, about 44 points above the U.S. average of 28%.
Paved land cover and Democratic lean
Places with extensive paved surfaces tend to lean Democratic; El Toro Marine Air Station, Irvine, CA sits above the national average on this measure. Paved ground does not change how people vote; it mostly reflects how urban and built-up a place is.
Why turnout in El Toro Marine Air Station looks the way it does
High-crime urban areas turn out at lower rates, mostly because the housing stress common in those areas makes voting harder. El Toro Marine Air Station sits in the top 15% nationally on a violent-crime measure. See CrimeGrade for more details. Learn more about the findings and methodology on the political spectrum map.
Nearby Neighborhoods
- Orange County Great Park, Irvine, CA D+19
- Portola Springs, Irvine, CA D+15
- Woodbury, Irvine, CA D+16
- Spectrum, Irvine, CA D+14
- Irvine Health and Science Complex, Irvine, CA D+23
- Northwood, Irvine, CA D+10
- Northwood Point, Irvine, CA D+8
- El Camino Real, Irvine, CA D+10
- Oak Creek, Irvine, CA D+12
- Quail Hill, Irvine, CA D+15
Neighborhoods with Similar Populations
- Bloomfield-Allen, Des Moines, IA D+4
- Highland-Stoner Hill, Shreveport, LA D+39
- Friendly, Fort Washington, MD D+78
- Serramonte, Daly City, CA D+36
- North Shore, Haleiwa, HI D+7
- Holland, Minneapolis, MN D+67
- Flamingo-Lummus, Miami Beach, FL D+17
- Bulls Head, Staten Island, NY R+31
- Green Lake, Seattle, WA D+76
- Chinatown-San Francisco, San Francisco, CA D+38
Sources and methodology
Precinct-level voting records used to fit the model come from California Secretary of State, Elections, distributed by the Voting and Election Science Team. Demographic inputs come from the U.S. Census Bureau (ACS 5-year estimates and the 2020 Decennial Census). Health and environmental inputs come from the CDC (PLACES and the Environmental Justice Index). Land cover comes from the USGS and EPA. Election-day and lead-up weather come from PRISM 4km daily grids and the NOAA Global Historical Climatology Network. Mail-voting and election-administration patterns come from the MIT Election Lab's Survey of the Performance of American Elections. Block-group crime detail comes from CrimeGrade. Internet data and modeling support provided by ISPreports.org.
Modeling and analysis by the BestNeighborhood data science team. Full methodology and findings: political spectrum map.
Methodology reviewed by the BestNeighborhood data team. Last updated May 2026.