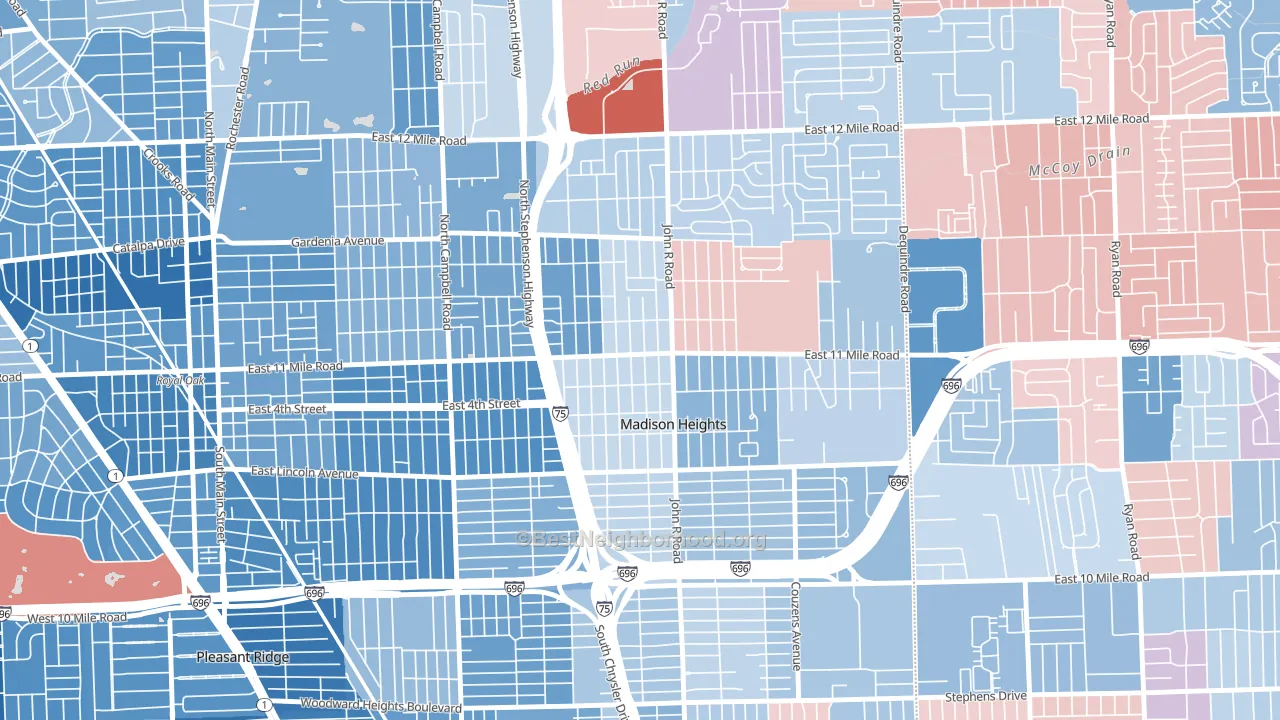
Downtown Madison Heights leans slightly Democratic by roughly 8 points: about 54% of voters vote Democratic and 46% Republican.
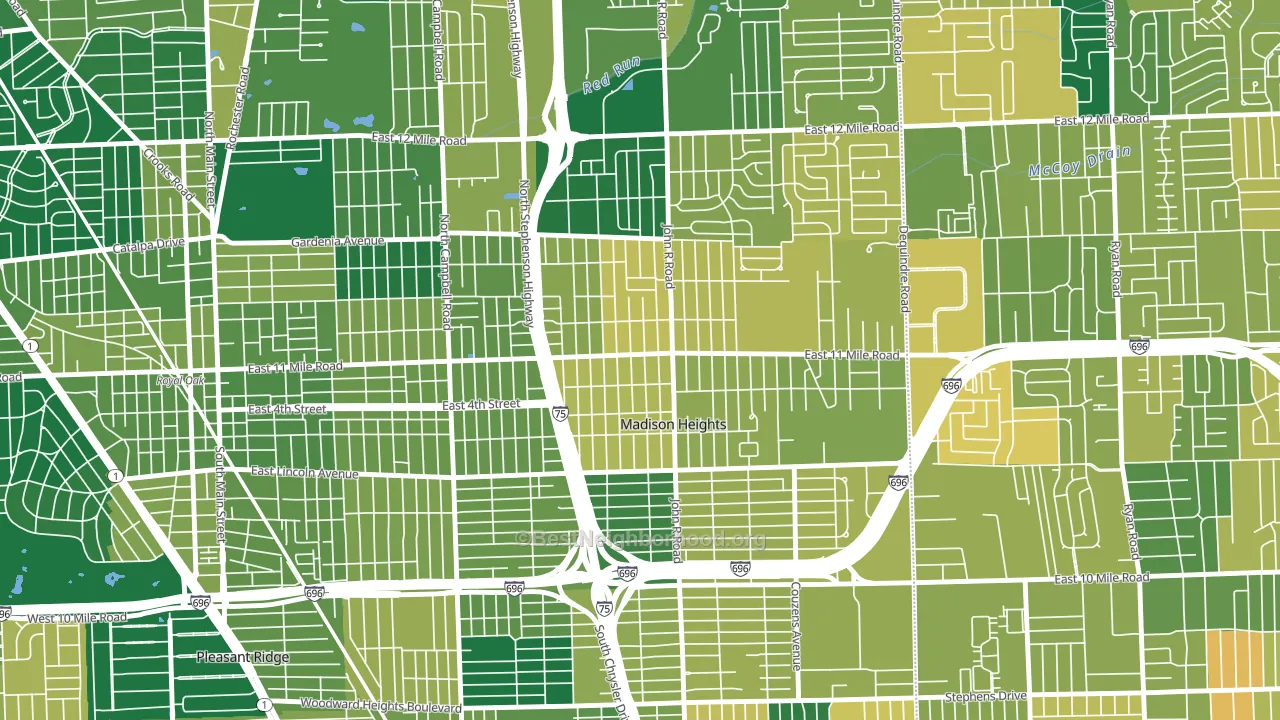
About 75% of adults in Downtown Madison Heights typically vote, above the U.S. average of about 62%. Among adults in Downtown Madison Heights, ~40% vote Democratic, ~35% Republican, and ~25% don't vote. The map below shows estimated turnout by block group.
How Downtown Madison Heights compares
Among neighborhoods within 5 miles, Downtown Madison Heights is the least Democratic-leaning.
Downtown Madison Heights runs about 10 points more Democratic than Michigan as a whole.
Politics vary noticeably by block within Downtown Madison Heights. The southwest side is the most Democratic-leaning (D+36) and the south side is the least Democratic-leaning (Even), a spread of about 36 points.
Why Downtown Madison Heights leans the way it does
This analysis examined 14,881 data points per neighborhood to find what predicts political lean and turnout. The items below are a few correlations that stood out for Downtown Madison Heights, not a ranked or complete list of what matters most.
Density pulls a place toward Democrats and a high white share pulls it toward Republicans. In Downtown Madison Heights the two roughly cancel.
Park access and Democratic lean
Places with heavy park coverage tend to lean Democratic; Downtown Madison Heights, Madison Heights, MI sits in the top quarter nationally on this measure. Park access does not change how people vote; it tends to track denser, higher-income areas.
Why turnout in Downtown Madison Heights looks the way it does
Areas with strong routine healthcare access turn out at higher rates. Downtown Madison Heights is in the top quarter nationally for routine-care measures such as insurance coverage, preventive screenings, and dental visits. The dental-visit rate here is about 71%, about 11 points above the U.S. average of 60%. Homeowners vote more often than renters, and about 85% of households in Downtown Madison Heights own their home, compared to around 58% in nearby neighborhoods. Learn more about the findings and methodology on the political spectrum map.
Nearby Neighborhoods
- Downtown Royal Oak, Royal Oak, MI D+46
- Eight Mile Wyoming, Detroit, MI D+88
- Conant Gardens, Detroit, MI D+86
- State Fair-Nolan, Highland Park, MI D+66
- Pershing, Detroit, MI D+86
- Pembroke, Detroit, MI D+89
- Kranz Woods, Detroit, MI D+87
- Bagley, Detroit, MI D+89
- Downtown Troy, Troy, MI D+26
- Martin Park, Detroit, MI D+80
Neighborhoods with Similar Populations
- Borchert Field, Milwaukee, WI D+88
- Mission Bend South, Mission Bend, TX D+21
- Woodlawn Court, Hattiesburg, MS D+54
- Livingston-McNaughten, Columbus, OH D+58
- North End, Phillipsburg, NJ D+6
- Orchard, Oxnard, CA D+31
- Downtown Belle Glade, Belle Glade, FL D+73
- Menomonee River Hills East, Milwaukee, WI D+63
- Suburban Acres, Norfolk, VA D+36
- The Boulevards, Canton, OH D+21
Sources and methodology
Precinct-level voting records used to fit the model come from Michigan Department of State, Elections, distributed by the Voting and Election Science Team. Demographic inputs come from the U.S. Census Bureau (ACS 5-year estimates and the 2020 Decennial Census). Health and environmental inputs come from the CDC (PLACES and the Environmental Justice Index). Land cover comes from the USGS and EPA. Election-day and lead-up weather come from PRISM 4km daily grids and the NOAA Global Historical Climatology Network. Mail-voting and election-administration patterns come from the MIT Election Lab's Survey of the Performance of American Elections. Block-group crime detail comes from CrimeGrade. Internet data and modeling support provided by ISPreports.org.
Modeling and analysis by the BestNeighborhood data science team. Full methodology and findings: political spectrum map.
Methodology reviewed by the BestNeighborhood data team. Last updated May 2026.