Downtown Walnut Creek is a Democratic stronghold. About 76% of voters here vote Democratic and 24% Republican.
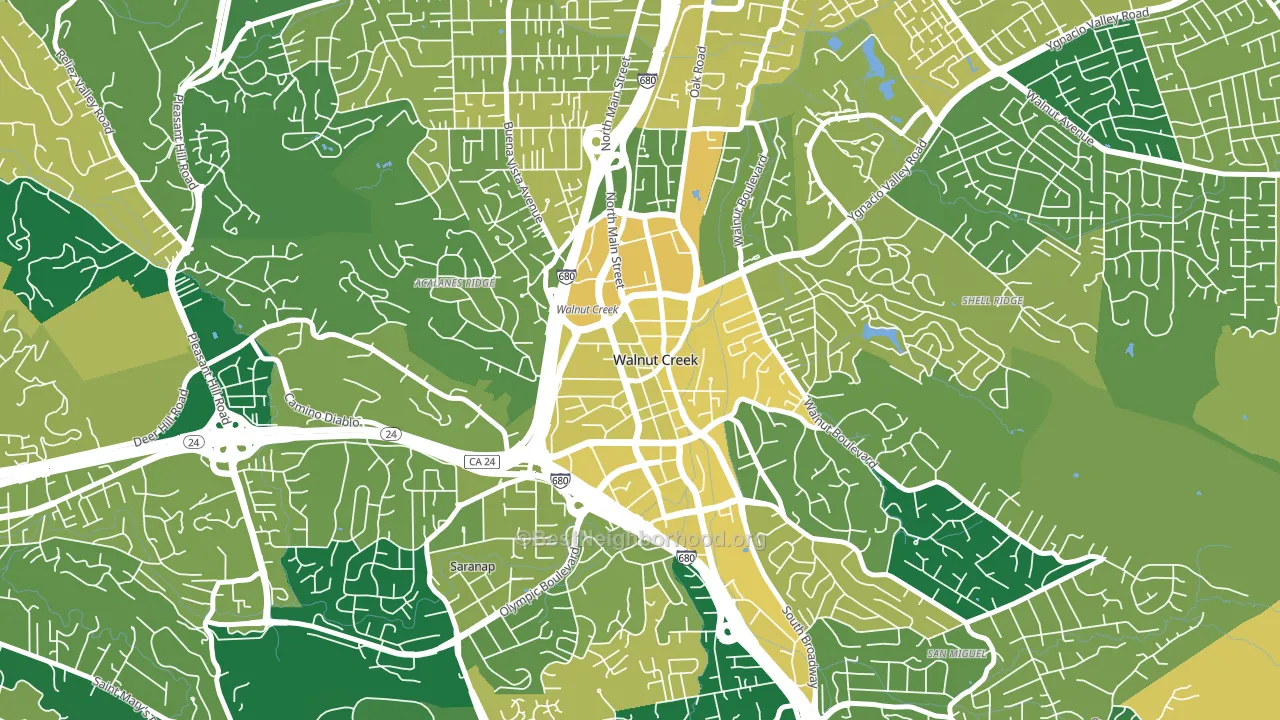
About 60% of adults in Downtown Walnut Creek typically vote, near the U.S. average of about 62%. Among adults in Downtown Walnut Creek, ~46% vote Democratic, ~14% Republican, and ~40% don't vote. The map below shows estimated turnout by block group.
How Downtown Walnut Creek compares
Among neighborhoods within 5 miles, Downtown Walnut Creek leans more Democratic than 4 of 5 neighbors.
Downtown Walnut Creek runs about 32 points more Democratic than California as a whole.
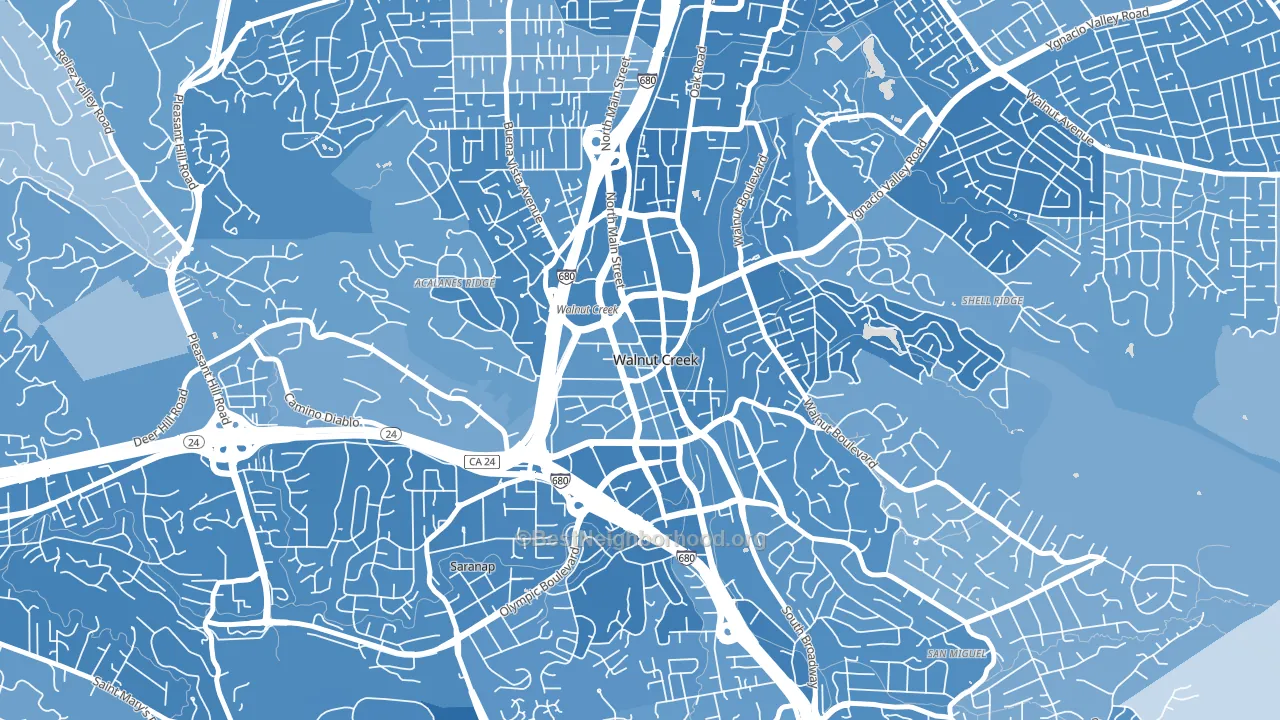
Politics vary noticeably by block within Downtown Walnut Creek. The southwest side is the most Democratic-leaning (D+55) and the southeast side is the least Democratic-leaning (D+44), a spread of about 11 points.
Why Downtown Walnut Creek leans the way it does
This analysis examined 14,881 data points per neighborhood to find what predicts political lean and turnout. The items below are a few correlations that stood out for Downtown Walnut Creek, not a ranked or complete list of what matters most.
Dense areas vote Democratic. More than 99% of residents in Downtown Walnut Creek live in densely developed areas, about 64 points above the U.S. average of 36%. High college attainment predicts Democratic voting, and Downtown Walnut Creek sits in the top quarter (about 72%, above 92% of neighborhoods).
Walkability and Democratic lean
Places with a highly walkable street grid tend to lean Democratic; Downtown Walnut Creek, Walnut Creek, CA sits in the top tenth nationally on this measure. A walkable street grid does not change how people vote; it mostly reflects how urban a place is.
Why turnout in Downtown Walnut Creek looks the way it does
Renters vote less often than owners. About 64% of households in Downtown Walnut Creek rent, about 39 points above the U.S. average of 25%. Strong routine healthcare access lines up with higher turnout, and Downtown Walnut Creek sits in the top quarter on routine-care measures. Crowded housing lines up with lower turnout, and about 6% of homes in Downtown Walnut Creek have more than one occupant per room, above 80% of neighborhoods. Learn more about the findings and methodology on the political spectrum map.
Nearby Neighborhoods
- Pleasant Valley, Walnut Creek, CA D+49
- Northgate Area, Walnut Creek, CA D+38
- Downtown Lafayette, Lafayette, CA D+53
- Cambridge Park, Concord, CA D+40
- Ellis Lake, Concord, CA D+42
- Downtown Concord, Concord, CA D+44
- Pacheco-Martinez, Martinez, CA D+32
- Piedmont Pines, Oakland, CA D+66
- Merriwood, Oakland, CA D+64
- Montclair, Oakland, CA D+71
Neighborhoods with Similar Populations
- Central Business District, Kansas City, MO D+51
- Zilker, Austin, TX D+45
- Oak Hill, Jacksonville, FL D+31
- Santo Nino, Laredo, TX D+7
- Midway-Coldstream, Baltimore, MD D+85
- Day Square, Boston, MA D+43
- Lakeside, San Antonio, TX D+24
- Bethel Welborn, Kansas City, KS D+41
- Sherman Heights, San Diego, CA D+45
- Duboce Triangle, San Francisco, CA D+83
Sources and methodology
Precinct-level voting records used to fit the model come from California Secretary of State, Elections, distributed by the Voting and Election Science Team. Demographic inputs come from the U.S. Census Bureau (ACS 5-year estimates and the 2020 Decennial Census). Health and environmental inputs come from the CDC (PLACES and the Environmental Justice Index). Land cover comes from the USGS and EPA. Election-day and lead-up weather come from PRISM 4km daily grids and the NOAA Global Historical Climatology Network. Mail-voting and election-administration patterns come from the MIT Election Lab's Survey of the Performance of American Elections. Block-group crime detail comes from CrimeGrade. Internet data and modeling support provided by ISPreports.org.
Modeling and analysis by the BestNeighborhood data science team. Full methodology and findings: political spectrum map.
Methodology reviewed by the BestNeighborhood data team. Last updated May 2026.