Londontowne is a true toss-up. About 50% of voters here vote Democratic and 50% Republican.
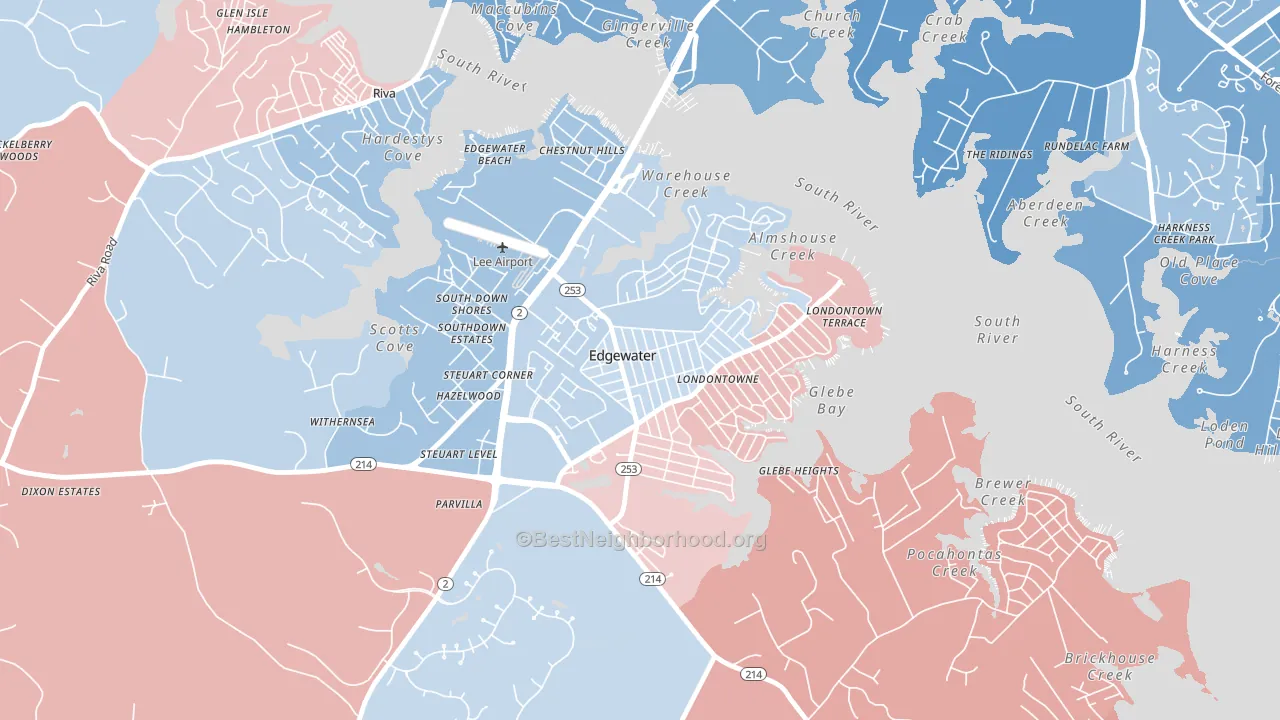
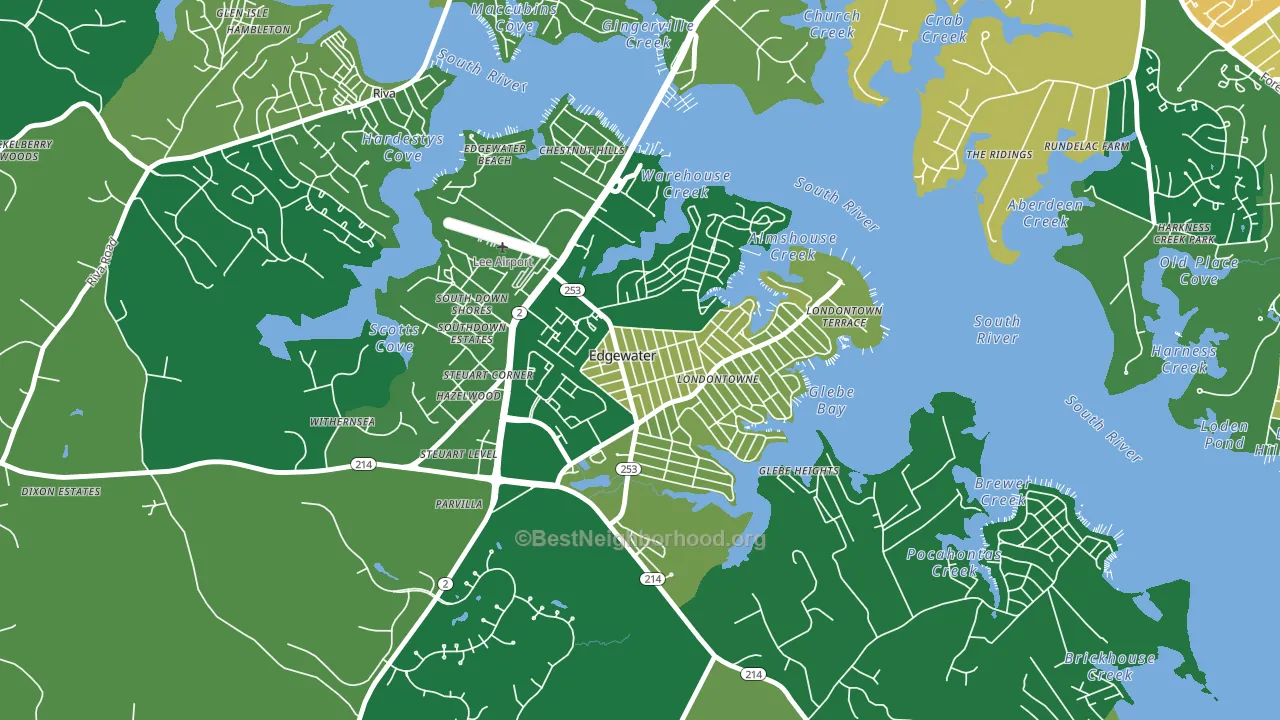
About 87% of adults in Londontowne typically vote, above the U.S. average of about 62%. Among adults in Londontowne, ~43% vote Democratic, ~44% Republican, and ~13% don't vote. The map below shows estimated turnout by block group.
How Londontowne compares
Among neighborhoods within 5 miles, Londontowne sits roughly in the middle of the political spectrum, with 2 neighbors leaning further in the place's direction and 1 leaning the other way.
Londontowne runs about 29 points more Republican than Maryland as a whole. Maryland leans Democratic overall, while Londontowne sits closer to the political middle.
Politics vary noticeably by block within Londontowne. The northwest side runs the most Democratic (D+12) and the east side runs the most Republican (R+8), a spread of about 20 points.
Why Londontowne leans the way it does
This analysis examined 14,881 data points per neighborhood to find what predicts political lean and turnout. The items below are a few correlations that stood out for Londontowne, not a ranked or complete list of what matters most.
Londontowne votes against the grain of Maryland. Maryland leans Democratic overall, while Londontowne runs about 29 points more Republican.
Preventive-care access and voter turnout
Places with strong routine preventive-care access tend to turn out at a higher rate; Londontowne, Edgewater, MD sits above the national average on this measure. Dental visits do not drive turnout; the rate reflects income, insurance, and healthcare access, which line up with who votes.
Why turnout in Londontowne looks the way it does
Areas with strong routine healthcare access turn out at higher rates. Londontowne is in the top quarter nationally for routine-care measures such as insurance coverage, preventive screenings, and dental visits. The dental-visit rate here is about 68%, about 8 points above the U.S. average of 60%. Learn more about the findings and methodology on the political spectrum map.
Nearby Neighborhoods
- Selby-on-the-Bay, Mayo, MD R+13
- Hillsmere Shores, Annapolis Neck, MD D+19
- Downtown Annapolis, Annapolis, MD D+46
- Greater Upper Marlboro, Brock Hall, MD D+81
- Green Haven, Pasadena, MD R+13
- South Gate, Glen Burnie, MD D+32
- School Gardens, Riviera Beach, MD R+19
- Lanham-Seabrook, Lanham, MD D+67
- Goddard, Seabrook, MD D+71
- Greater Landover, Landover, MD D+78
Neighborhoods with Similar Populations
- Loretto, Jacksonville, FL R+24
- Eastgate, Bellevue, WA D+42
- Craven, Jacksonville, FL R+3
- East Springfield, Springfield, MA D+19
- Solivita, Poinciana, FL Even
- Napili-Honokowai, Lahaina, HI D+18
- Secret Cove, Jacksonville, FL D+13
- Felida-Starcrest, Vancouver, WA D+16
- Cross Fletcher, University, FL D+35
- Far Westside, Syracuse, NY D+27
Sources and methodology
Precinct-level voting records used to fit the model come from Maryland State Board of Elections, distributed by the Voting and Election Science Team. Demographic inputs come from the U.S. Census Bureau (ACS 5-year estimates and the 2020 Decennial Census). Health and environmental inputs come from the CDC (PLACES and the Environmental Justice Index). Land cover comes from the USGS and EPA. Election-day and lead-up weather come from PRISM 4km daily grids and the NOAA Global Historical Climatology Network. Mail-voting and election-administration patterns come from the MIT Election Lab's Survey of the Performance of American Elections. Block-group crime detail comes from CrimeGrade. Internet data and modeling support provided by ISPreports.org.
Modeling and analysis by the BestNeighborhood data science team. Full methodology and findings: political spectrum map.
Methodology reviewed by the BestNeighborhood data team. Last updated May 2026.