Outer Richmond is a Democratic stronghold. About 78% of voters here vote Democratic and 22% Republican.
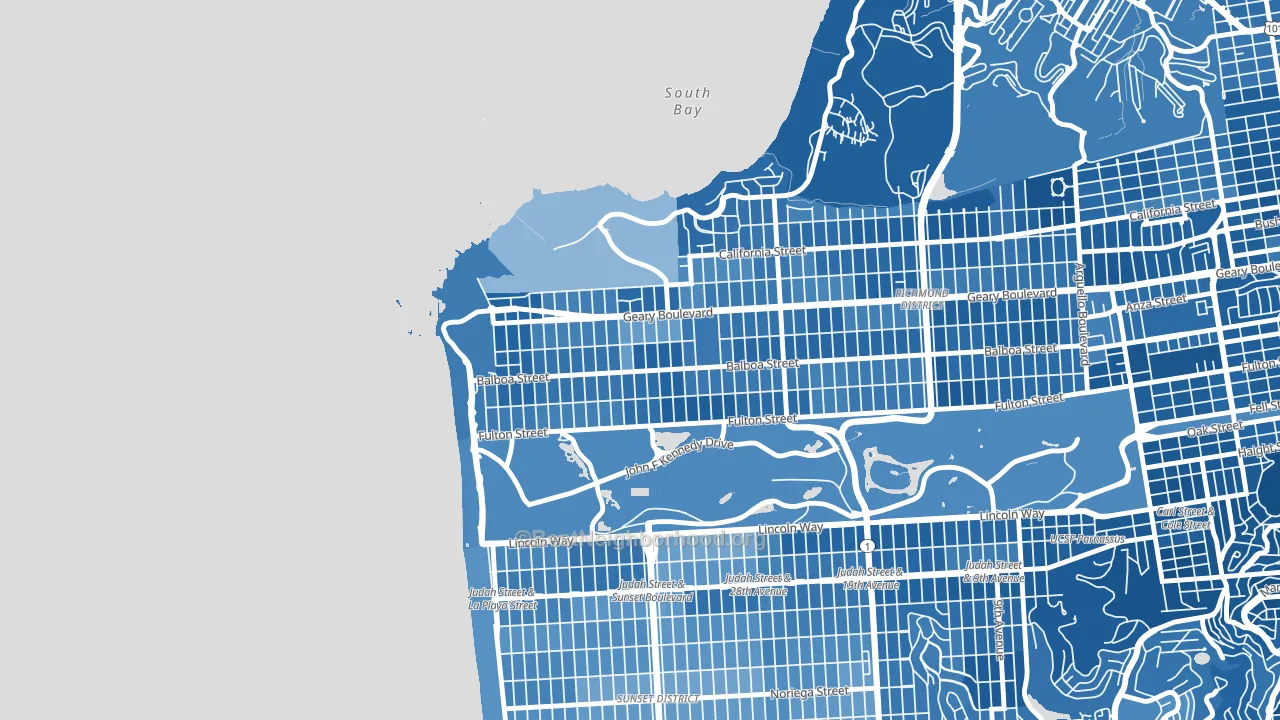
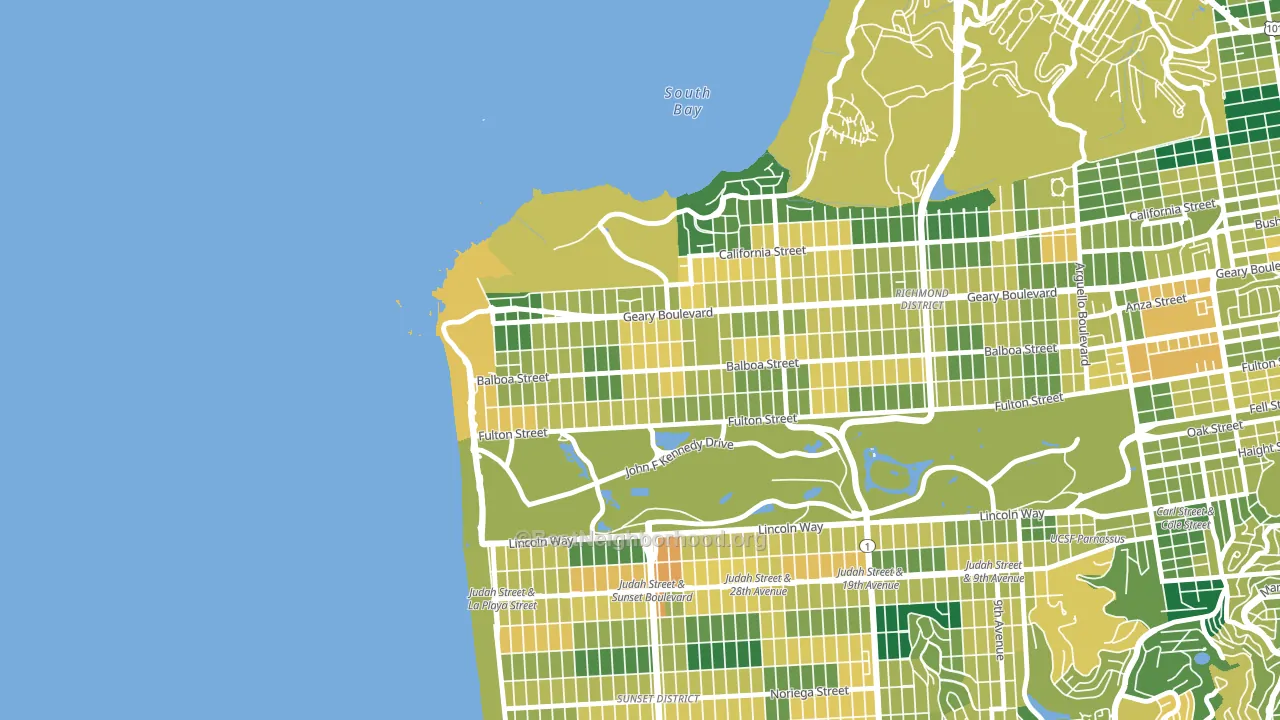
About 66% of adults in Outer Richmond typically vote, near the U.S. average of about 62%. Among adults in Outer Richmond, ~51% vote Democratic, ~15% Republican, and ~34% don't vote. The map below shows estimated turnout by block group.
How Outer Richmond compares
Among neighborhoods within 5 miles, Outer Richmond leans more Democratic than 8 of 30 neighbors.
Outer Richmond runs about 36 points more Democratic than California as a whole.
Why Outer Richmond leans the way it does
This analysis examined 14,881 data points per neighborhood to find what predicts political lean and turnout. The items below are a few correlations that stood out for Outer Richmond, not a ranked or complete list of what matters most.
Areas with high college attainment vote Democratic. About 64% of adults in Outer Richmond hold a bachelor's degree, about 36 points above the U.S. average of 28%.
Population density and Democratic lean
Places with high population density tend to lean Democratic; Outer Richmond, San Francisco, CA sits in the top tenth nationally on this measure.
Why turnout in Outer Richmond looks the way it does
Turnout in Outer Richmond sits close to the national pattern. Routine healthcare access, homeownership, education, and food security all land near their national averages here. Learn more about the findings and methodology on the political spectrum map.
Nearby Neighborhoods
- Seacliff, San Francisco, CA D+59
- Outer Sunset, San Francisco, CA D+49
- Inner Richmond, San Francisco, CA D+68
- Inner Sunset, San Francisco, CA D+72
- Parkside, San Francisco, CA D+48
- Presidio Heights, San Francisco, CA D+72
- Cole Valley, San Francisco, CA D+82
- Haight-Ashbury, San Francisco, CA D+82
- Twin Peaks, San Francisco, CA D+67
- Saint Francis Wood, San Francisco, CA D+55
Neighborhoods with Similar Populations
- Bear Creek, Stockton, CA D+15
- Tierrasanta, San Diego, CA D+20
- Lower Peters Canyon, Irvine, CA D+13
- Liliha-Kapalama, Honolulu, HI D+23
- Villages of Palm Beach Lakes, West Palm Beach, FL D+31
- Golden Glades-The Woods, Jacksonville, FL R+17
- Northwest Dallas, Dallas, TX D+11
- Ocean View, San Francisco, CA D+45
- Charles Village, Baltimore, MD D+79
- South Phoenix, Phoenix, AZ D+30
Sources and methodology
Precinct-level voting records used to fit the model come from California Secretary of State, Elections, distributed by the Voting and Election Science Team. Demographic inputs come from the U.S. Census Bureau (ACS 5-year estimates and the 2020 Decennial Census). Health and environmental inputs come from the CDC (PLACES and the Environmental Justice Index). Land cover comes from the USGS and EPA. Election-day and lead-up weather come from PRISM 4km daily grids and the NOAA Global Historical Climatology Network. Mail-voting and election-administration patterns come from the MIT Election Lab's Survey of the Performance of American Elections. Block-group crime detail comes from CrimeGrade. Internet data and modeling support provided by ISPreports.org.
Modeling and analysis by the BestNeighborhood data science team. Full methodology and findings: political spectrum map.
Methodology reviewed by the BestNeighborhood data team. Last updated May 2026.