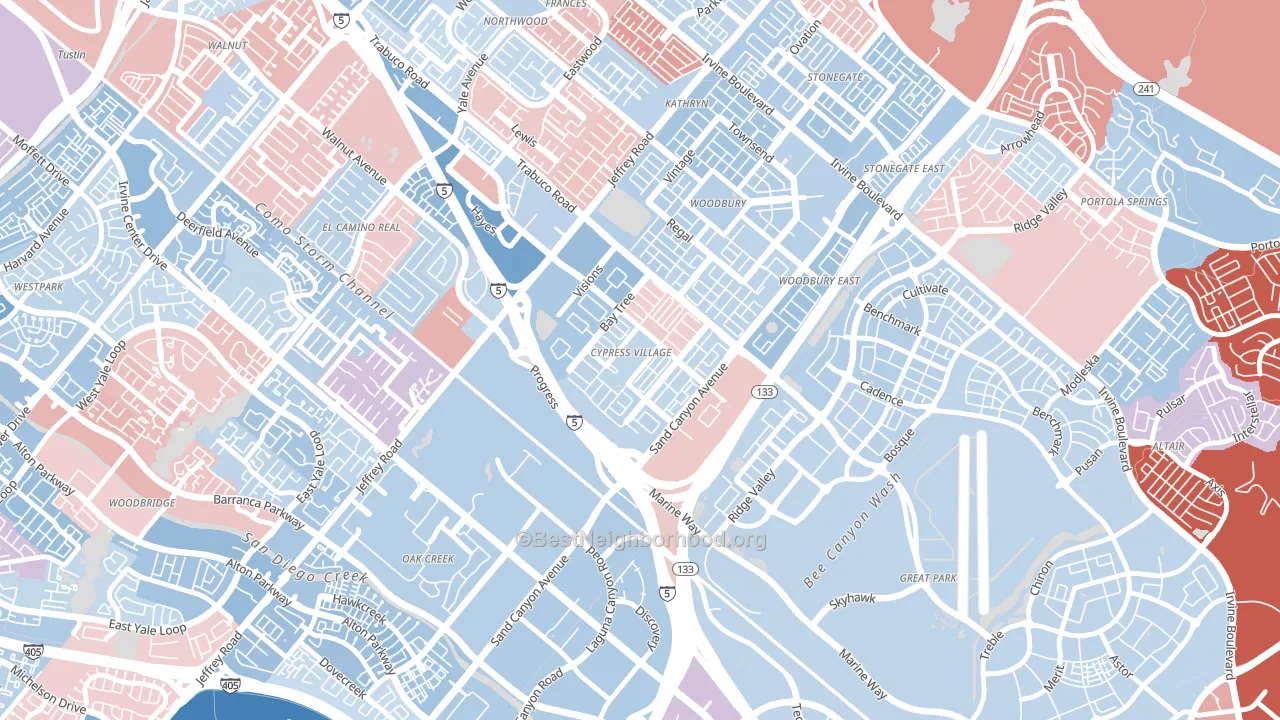
Spectrum leans slightly Democratic by roughly 14 points: about 57% of voters vote Democratic and 43% Republican.
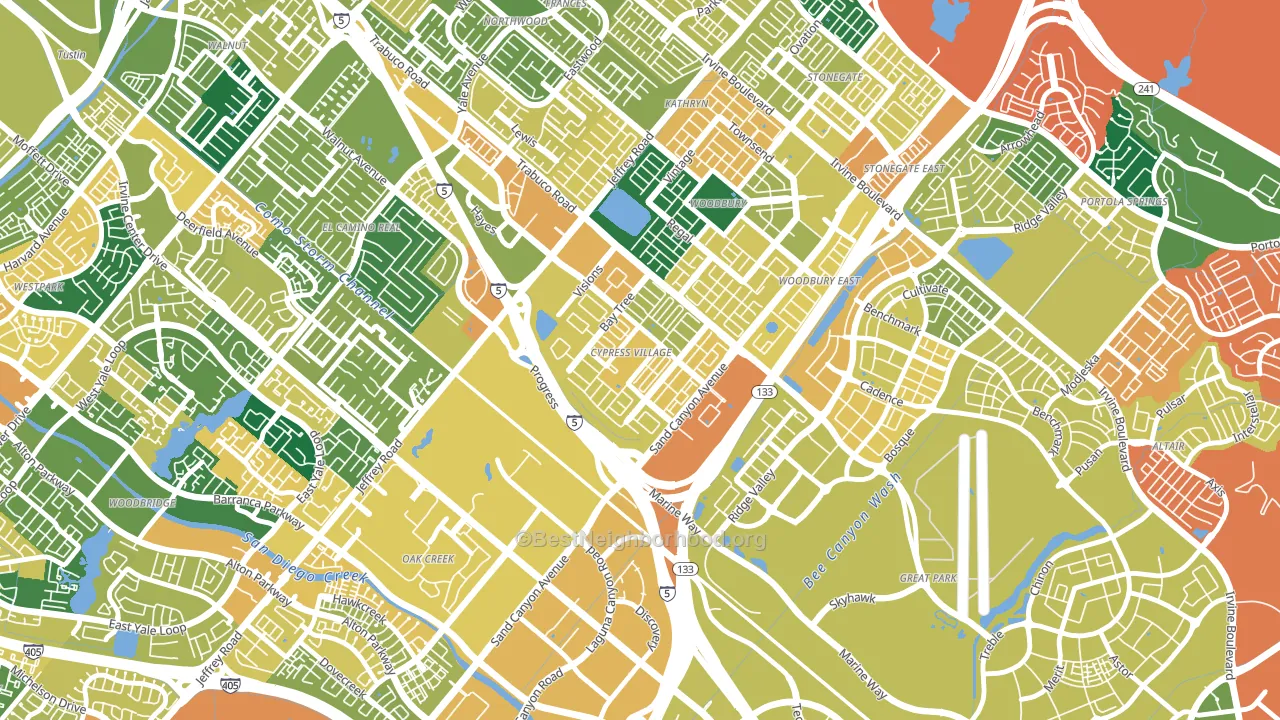
About 52% of adults in Spectrum typically vote, below the U.S. average of about 62%. Among adults in Spectrum, ~30% vote Democratic, ~22% Republican, and ~48% don't vote. The map below shows estimated turnout by block group.
How Spectrum compares
Among neighborhoods within 5 miles, Spectrum leans more Democratic than 11 of 20 neighbors.
Spectrum runs about 6 points more Republican than California as a whole.
Politics vary noticeably by block within Spectrum. The southeast side is the most Democratic-leaning (D+22) and the north side is the least Democratic-leaning (D+10), a spread of about 12 points.
Why Spectrum leans the way it does
This analysis examined 14,881 data points per neighborhood to find what predicts political lean and turnout. The items below are a few correlations that stood out for Spectrum, not a ranked or complete list of what matters most.
Areas with high college attainment vote Democratic. About 69% of adults in Spectrum hold a bachelor's degree, about 40 points above the U.S. average of 28%.
Paved land cover and Democratic lean
Places with extensive paved surfaces tend to lean Democratic; Spectrum, Irvine, CA sits in the top quarter nationally on this measure. Paved ground does not change how people vote; it mostly reflects how urban and built-up a place is.
Why turnout in Spectrum looks the way it does
Crowded housing lines up with lower turnout. About 12% of homes in Spectrum have more than one occupant per room, above 93% of neighborhoods. Strong routine healthcare access lines up with higher turnout, and Spectrum sits in the top quarter on routine-care measures. Learn more about the findings and methodology on the political spectrum map.
Nearby Neighborhoods
- Woodbury, Irvine, CA D+16
- El Camino Real, Irvine, CA D+10
- Northwood, Irvine, CA D+10
- Oak Creek, Irvine, CA D+12
- Orange County Great Park, Irvine, CA D+19
- El Toro Marine Air Station, Irvine, CA D+18
- Irvine Health and Science Complex, Irvine, CA D+23
- Portola Springs, Irvine, CA D+15
- Northwood Point, Irvine, CA D+8
- Walnut Village, Irvine, CA D+12
Neighborhoods with Similar Populations
- Orchards Area, Orchards, WA Even
- Bowmanville, Chicago, IL D+64
- Downtown Fullerton, Fullerton, CA D+23
- Iron Triangle, Richmond, CA D+54
- Firestone Park, Akron, OH D+24
- Martin Luther, Chicago, IL D+26
- State Fair-Nolan, Highland Park, MI D+66
- Washington Square, Syracuse, NY D+32
- Ridgeland, Oak Park, IL D+82
- Hybla Valley, Alexandria, VA D+43
Sources and methodology
Precinct-level voting records used to fit the model come from California Secretary of State, Elections, distributed by the Voting and Election Science Team. Demographic inputs come from the U.S. Census Bureau (ACS 5-year estimates and the 2020 Decennial Census). Health and environmental inputs come from the CDC (PLACES and the Environmental Justice Index). Land cover comes from the USGS and EPA. Election-day and lead-up weather come from PRISM 4km daily grids and the NOAA Global Historical Climatology Network. Mail-voting and election-administration patterns come from the MIT Election Lab's Survey of the Performance of American Elections. Block-group crime detail comes from CrimeGrade. Internet data and modeling support provided by ISPreports.org.
Modeling and analysis by the BestNeighborhood data science team. Full methodology and findings: political spectrum map.
Methodology reviewed by the BestNeighborhood data team. Last updated May 2026.