Roosevelt County leans heavily Republican by roughly 36 points: about 32% of voters vote Democratic and 68% Republican.
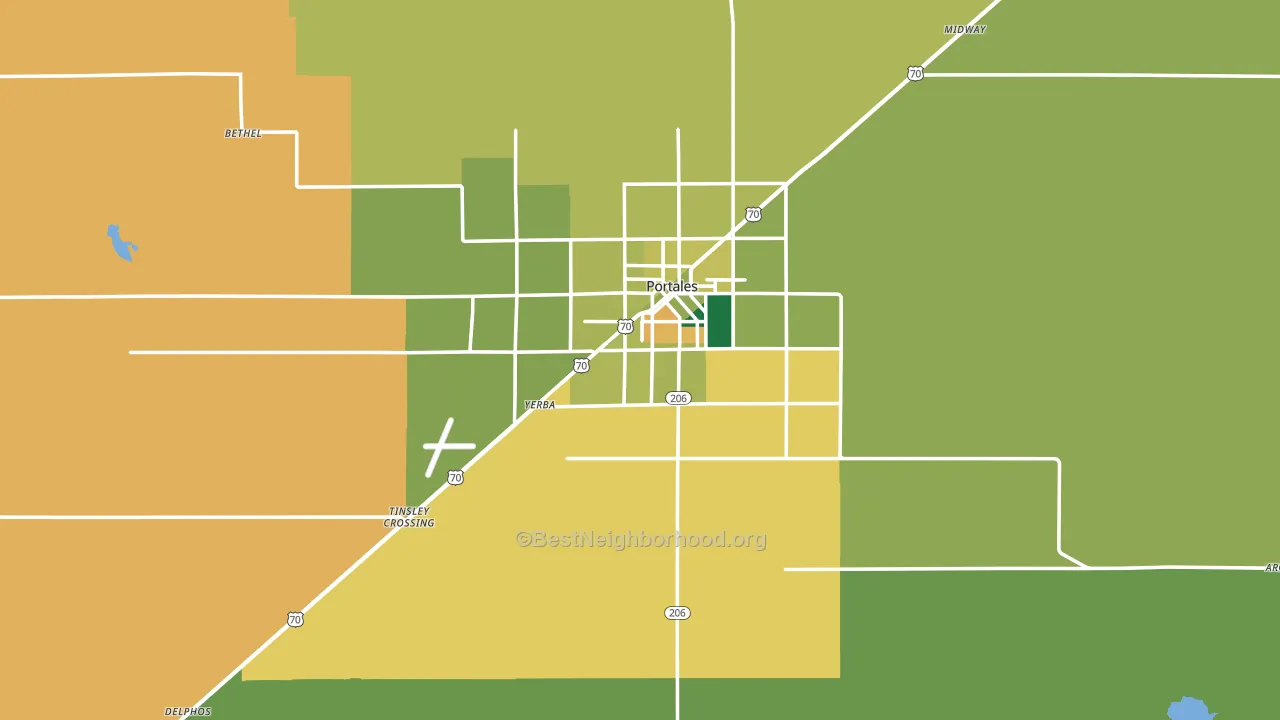
About 61% of adults in Roosevelt County typically vote, near the U.S. average of about 62%. Among adults in Roosevelt County, ~19% vote Democratic, ~42% Republican, and ~39% don't vote. The map below shows estimated turnout by block group.
How Roosevelt County compares
Among counties within 50 miles, Roosevelt County leans more Republican than 1 of 4 neighbors.
Roosevelt County runs about 43 points more Republican than New Mexico as a whole. New Mexico leans Democratic overall, while Roosevelt County is one of the few Republican-leaning pockets.
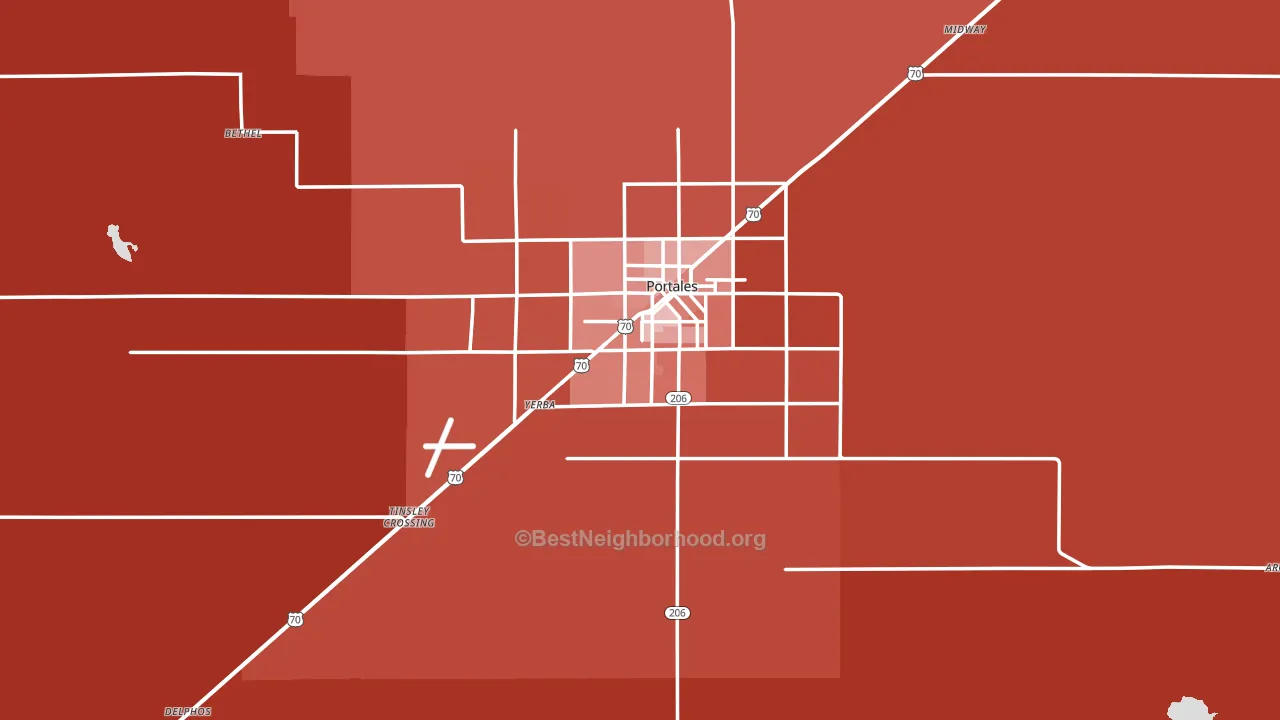
Politics vary noticeably by city within Roosevelt County. The southwest side is the most Republican-leaning (R+74) and the north side is the least Republican-leaning (R+23), a spread of about 51 points.
Why Roosevelt County leans the way it does
This analysis examined 14,881 data points per county to find what predicts political lean and turnout. The items below are a few correlations that stood out for Roosevelt County, not a ranked or complete list of what matters most.
Car-dependent areas vote Republican. About 83% of residents in Roosevelt County drive to work alone, about 10 points above the U.S. average of 74%. Roosevelt County runs against the grain of New Mexico, a Republican-leaning pocket in a Democratic-leaning state.
Park access and Republican lean
Places with low park coverage tend to lean Republican; Roosevelt County, NM sits in the bottom quarter nationally on this measure. Park access does not change how people vote; it tends to track denser, higher-income areas.
Why turnout in Roosevelt County looks the way it does
Areas with limited routine healthcare access turn out at lower rates. Roosevelt County is in the bottom quarter nationally for routine-care measures such as insurance coverage, preventive screenings, and dental visits. Renters vote less often than owners, and about 42% of households in Roosevelt County rent, about 17 points above the U.S. average of 25%. High food insecurity lines up with lower turnout, and about 22% of adults in Roosevelt County report food insecurity, above 83% of counties. Learn more about the findings and methodology on the political spectrum map.
Nearby Counties
- Curry County, NM R+34
- Bailey County, TX R+49
- Parmer County, TX R+50
- Cochran County, TX R+47
- De Baca County, NM R+35
- Lamb County, TX R+57
- Castro County, TX R+40
- Deaf Smith County, TX R+30
- Hockley County, TX R+63
- Quay County, NM R+32
Counties with Similar Populations
- Kent County, MD Even
- Perry County, IN R+39
- Polk County, AR R+63
- Beadle County, SD R+46
- Pickens County, AL R+21
- Gem County, ID R+58
- McDowell County, WV R+56
- Hart County, KY R+61
- Ashley County, AR R+46
- Marengo County, AL D+3
Sources and methodology
Precinct-level voting records used to fit the model come from New Mexico Secretary of State, Bureau of Elections, distributed by the Voting and Election Science Team. Demographic inputs come from the U.S. Census Bureau (ACS 5-year estimates and the 2020 Decennial Census). Health and environmental inputs come from the CDC (PLACES and the Environmental Justice Index). Land cover comes from the USGS and EPA. Election-day and lead-up weather come from PRISM 4km daily grids and the NOAA Global Historical Climatology Network. Mail-voting and election-administration patterns come from the MIT Election Lab's Survey of the Performance of American Elections. Block-group crime detail comes from CrimeGrade. Internet data and modeling support provided by ISPreports.org.
Modeling and analysis by the BestNeighborhood data science team. Full methodology and findings: political spectrum map.
Methodology reviewed by the BestNeighborhood data team. Last updated May 2026.