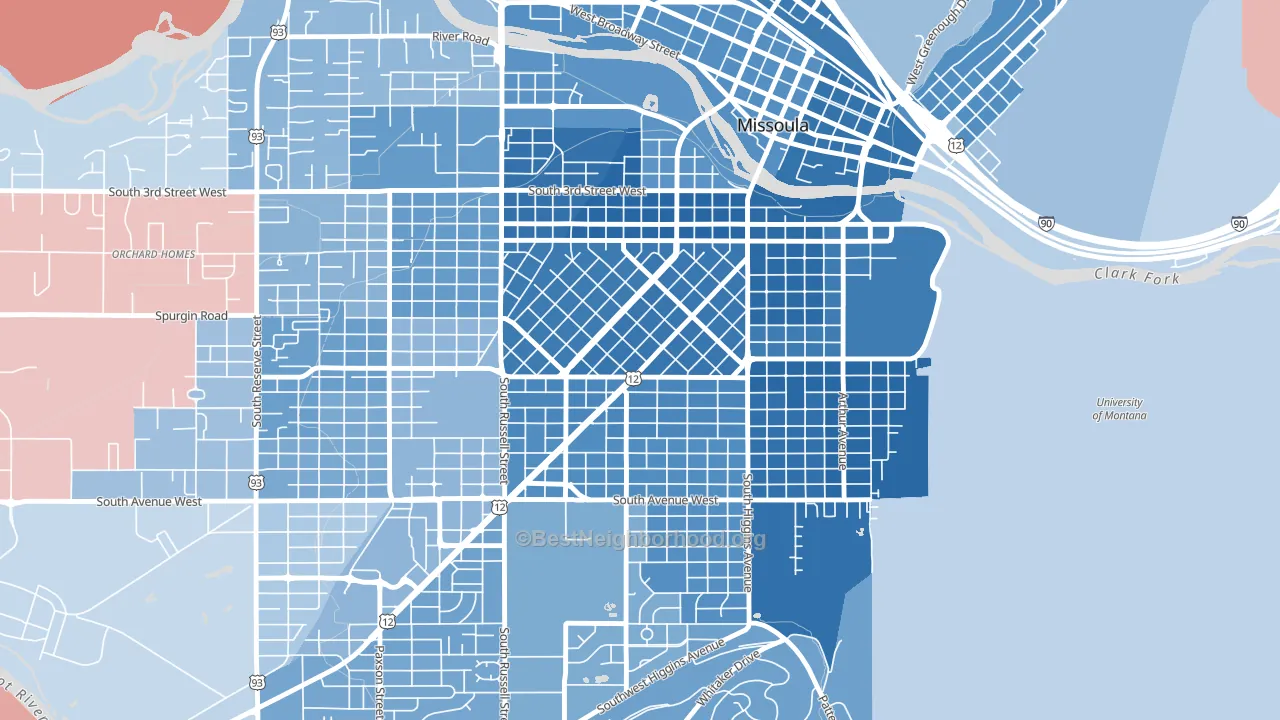
Rose Park is a Democratic stronghold. About 80% of voters here vote Democratic and 20% Republican.
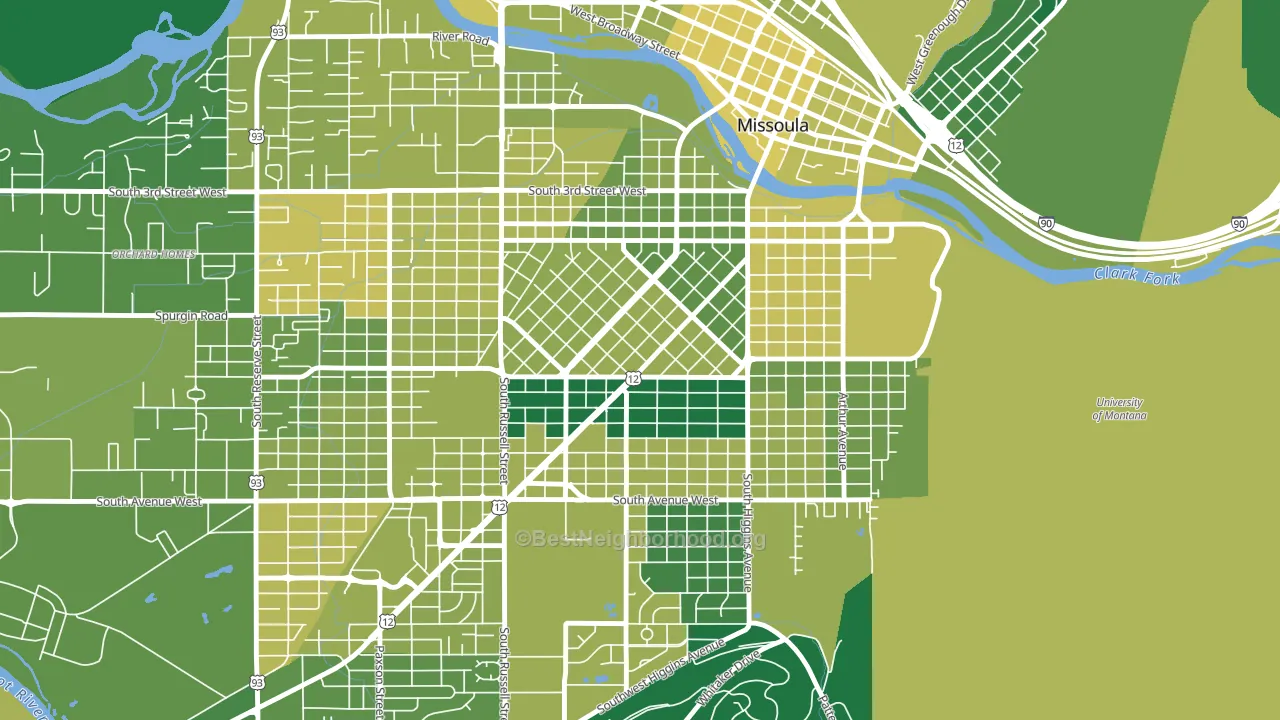
About 84% of adults in Rose Park typically vote, above the U.S. average of about 62%. Among adults in Rose Park, ~67% vote Democratic, ~17% Republican, and ~16% don't vote. The map below shows estimated turnout by block group.
How Rose Park compares
Among neighborhoods within 5 miles, Rose Park is the most Democratic-leaning.
Rose Park runs about 79 points more Democratic than Montana as a whole. Montana leans Republican overall, while Rose Park is one of the few Democratic-leaning pockets.
Politics vary noticeably by block within Rose Park. The northwest side is the most Democratic-leaning (D+65) and the southwest side is the least Democratic-leaning (D+47), a spread of about 18 points.
Why Rose Park leans the way it does
This analysis examined 14,881 data points per neighborhood to find what predicts political lean and turnout. The items below are a few correlations that stood out for Rose Park, not a ranked or complete list of what matters most.
Dense areas vote Democratic. More than 99% of residents in Rose Park live in densely developed areas, about 64 points above the U.S. average of 36%. High college attainment predicts Democratic voting, and Rose Park sits in the top quarter (about 65%, above 86% of neighborhoods). Rose Park runs against the grain of Montana, a Democratic-leaning pocket in a Republican-leaning state.
Paved land cover and Democratic lean
Places with extensive paved surfaces tend to lean Democratic; Rose Park, Missoula, MT sits in the top quarter nationally on this measure. Paved ground does not change how people vote; it mostly reflects how urban and built-up a place is.
Why turnout in Rose Park looks the way it does
Areas with high high-school completion turn out at higher rates. About 98% of adults in Rose Park have completed high school, about 8 points above the U.S. average of 90%. Learn more about the findings and methodology on the political spectrum map.
Nearby Neighborhoods
- University District, Missoula, MT D+59
- Lewis and Clark, Missoula, MT D+47
- Franklin To The Fort, Missoula, MT D+29
- Heart of Missoula, Missoula, MT D+51
- Southgate Triangle, Missoula, MT D+26
- Emma Dickinson Orchard Homes, Missoula, MT D+31
- Northside, Missoula, MT D+34
- Westside, Missoula, MT D+35
- South 39th Street, Missoula, MT D+14
- Moose Can Gully, Missoula, MT D+23
Neighborhoods with Similar Populations
- Mission Hills, Henderson, NV R+11
- Lafayette Park, Detroit, MI D+75
- Forest Home Hills, Milwaukee, WI D+40
- Town Center, Woodinville, WA D+36
- Feldheym, San Bernardino, CA D+25
- Archer Limits, Chicago, IL D+36
- Genesee Moselle, Buffalo, NY D+70
- Baynard Village, Wilmington, DE D+80
- Ridge, Pueblo, CO R+2
- North Ukiah, Ukiah, CA D+17
Sources and methodology
Precinct-level voting records used to fit the model come from Montana Secretary of State, Elections, distributed by the Voting and Election Science Team. Demographic inputs come from the U.S. Census Bureau (ACS 5-year estimates and the 2020 Decennial Census). Health and environmental inputs come from the CDC (PLACES and the Environmental Justice Index). Land cover comes from the USGS and EPA. Election-day and lead-up weather come from PRISM 4km daily grids and the NOAA Global Historical Climatology Network. Mail-voting and election-administration patterns come from the MIT Election Lab's Survey of the Performance of American Elections. Block-group crime detail comes from CrimeGrade. Internet data and modeling support provided by ISPreports.org.
Modeling and analysis by the BestNeighborhood data science team. Full methodology and findings: political spectrum map.
Methodology reviewed by the BestNeighborhood data team. Last updated May 2026.