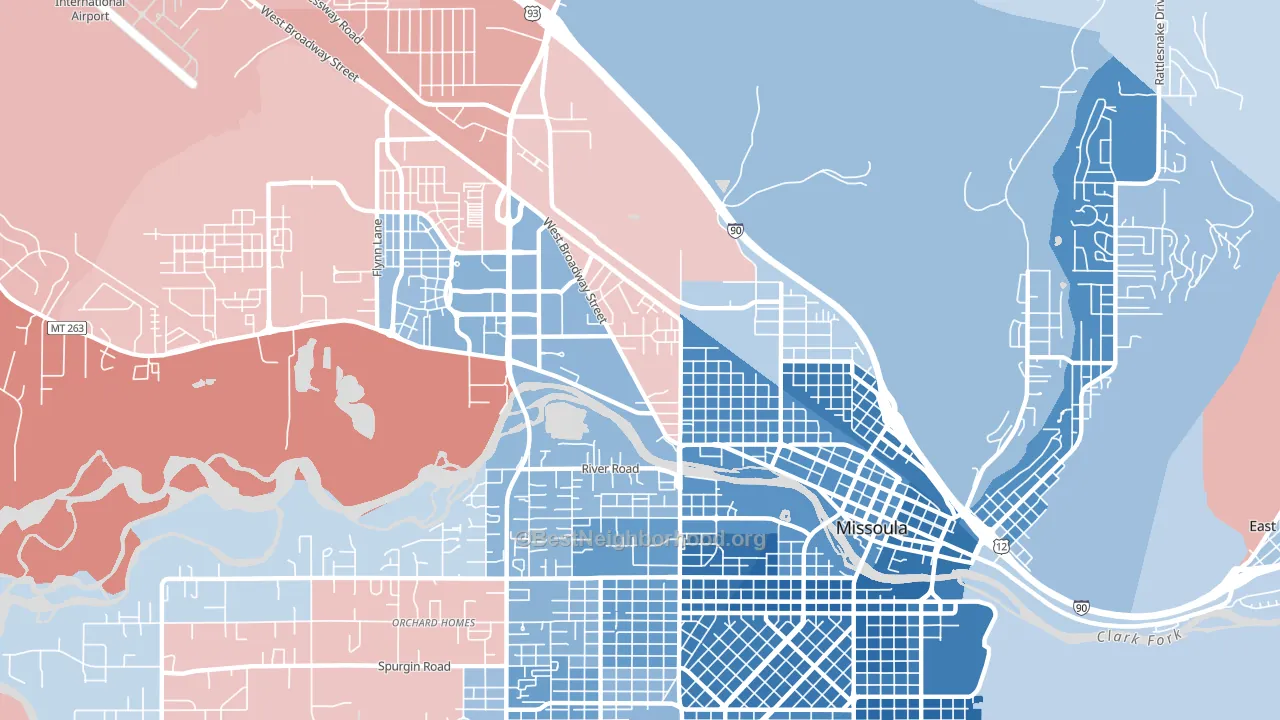
Westside leans heavily Democratic by roughly 34 points: about 67% of voters vote Democratic and 33% Republican.
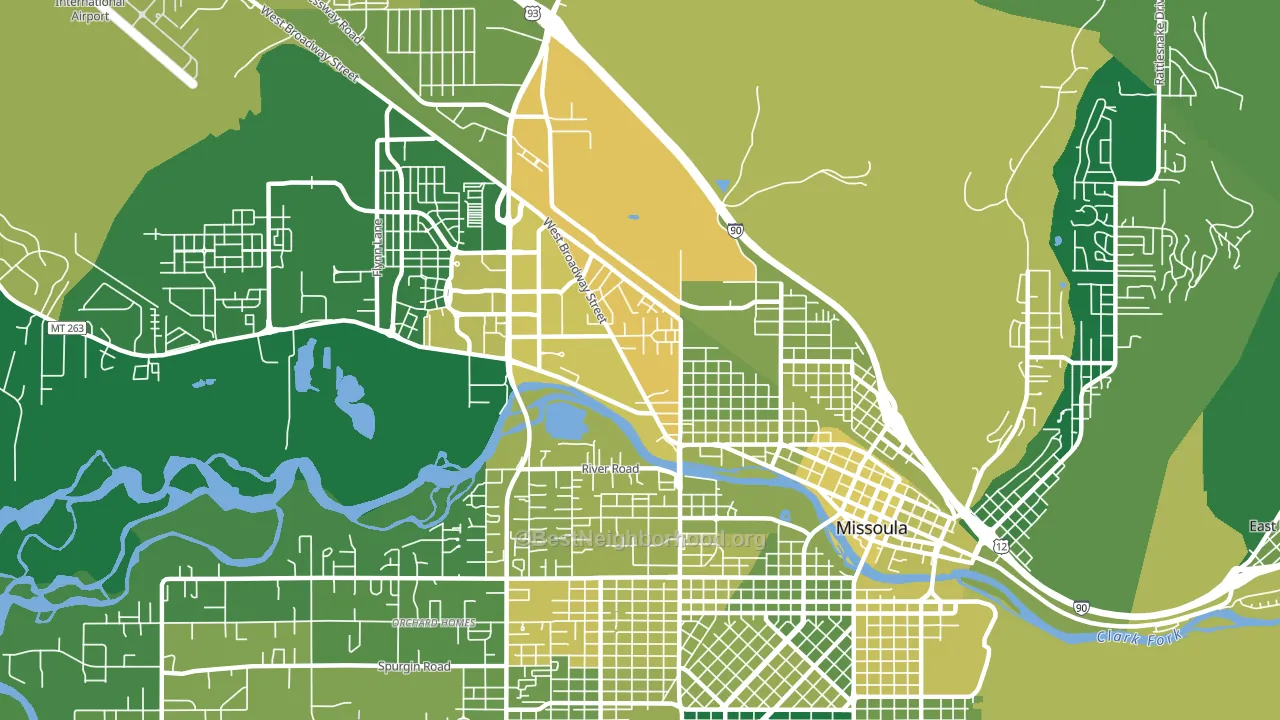
About 64% of adults in Westside typically vote, near the U.S. average of about 62%. Among adults in Westside, ~43% vote Democratic, ~21% Republican, and ~36% don't vote. The map below shows estimated turnout by block group.
How Westside compares
Among neighborhoods within 5 miles, Westside leans more Democratic than 7 of 12 neighbors.
Westside runs about 55 points more Democratic than Montana as a whole. Montana leans Republican overall, while Westside is one of the few Democratic-leaning pockets.
Politics vary noticeably by block within Westside. The east side runs the most Democratic (D+63) and the west side runs the most Republican (R+15), a spread of about 78 points.
Why Westside leans the way it does
This analysis examined 14,881 data points per neighborhood to find what predicts political lean and turnout. The items below are a few correlations that stood out for Westside, not a ranked or complete list of what matters most.
Westside votes against the grain of Montana. Montana leans Republican overall, while Westside runs about 55 points more Democratic. A high never-married share predicts Democratic voting, and about 56% of adults in Westside have never been married, above 89% of neighborhoods.
Paved land cover and Democratic lean
Places with extensive paved surfaces tend to lean Democratic; Westside, Missoula, MT sits in the top quarter nationally on this measure. Paved ground does not change how people vote; it mostly reflects how urban and built-up a place is.
Why turnout in Westside looks the way it does
Turnout in Westside sits close to the national pattern. Learn more about the findings and methodology on the political spectrum map.
Nearby Neighborhoods
- Emma Dickinson Orchard Homes, Missoula, MT D+31
- Northside, Missoula, MT D+34
- Captain John Mullan, Missoula, MT D+12
- Heart of Missoula, Missoula, MT D+51
- Franklin To The Fort, Missoula, MT D+29
- Rose Park, Missoula, MT D+59
- University District, Missoula, MT D+59
- Upper Rattlesnake, Missoula, MT D+47
- Southgate Triangle, Missoula, MT D+26
- Lewis and Clark, Missoula, MT D+47
Neighborhoods with Similar Populations
- Southeast, Brentwood, TN Even
- North End, Beaumont, TX D+71
- Potomac Yard-Potomac Greens, Alexandria, VA D+58
- Lower Garden District, New Orleans, LA D+47
- Moss Bay, Kirkland, WA D+45
- Westbury, Houston, TX D+43
- East Liberty, Pittsburgh, PA D+82
- Oakland Ave-Harrison Street, Oakland, CA D+81
- West Hill, Albany, NY D+66
- Buffalo Charles, Detroit, MI D+14
Sources and methodology
Precinct-level voting records used to fit the model come from Montana Secretary of State, Elections, distributed by the Voting and Election Science Team. Demographic inputs come from the U.S. Census Bureau (ACS 5-year estimates and the 2020 Decennial Census). Health and environmental inputs come from the CDC (PLACES and the Environmental Justice Index). Land cover comes from the USGS and EPA. Election-day and lead-up weather come from PRISM 4km daily grids and the NOAA Global Historical Climatology Network. Mail-voting and election-administration patterns come from the MIT Election Lab's Survey of the Performance of American Elections. Block-group crime detail comes from CrimeGrade. Internet data and modeling support provided by ISPreports.org.
Modeling and analysis by the BestNeighborhood data science team. Full methodology and findings: political spectrum map.
Methodology reviewed by the BestNeighborhood data team. Last updated May 2026.