Tyndall AFB leans heavily Republican by roughly 30 points: about 35% of voters vote Democratic and 65% Republican.
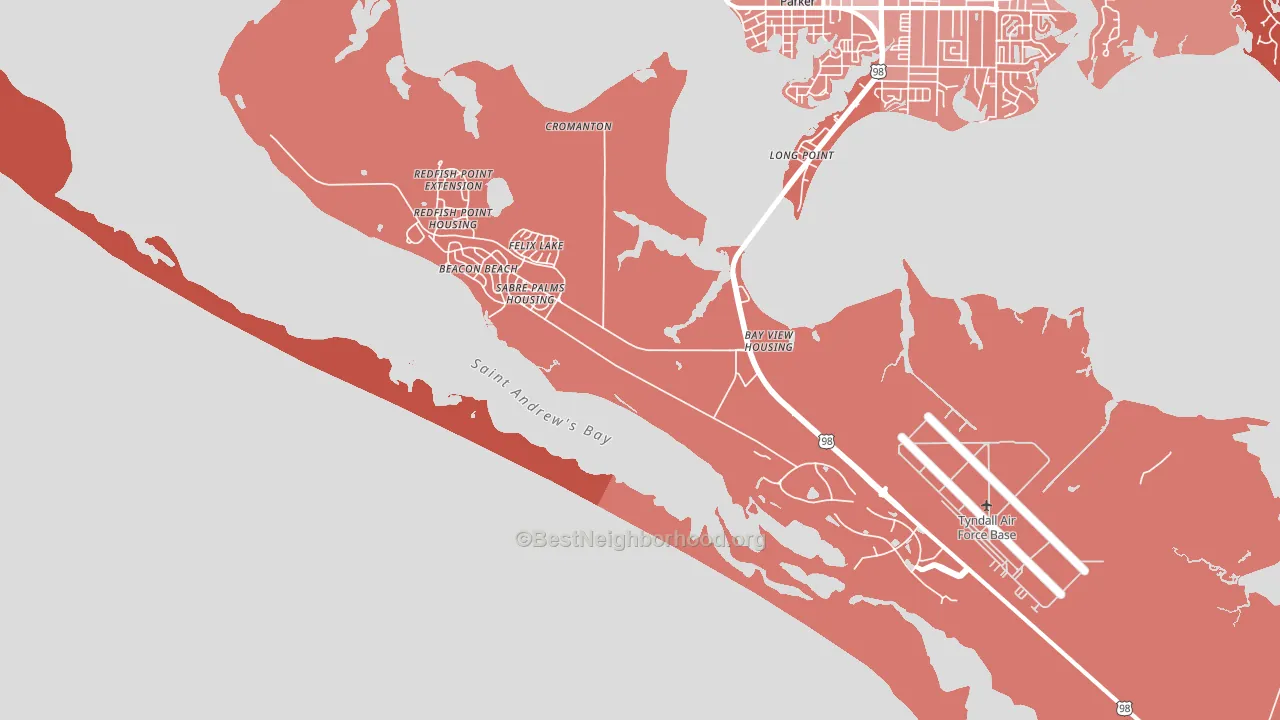
About 39% of adults in Tyndall AFB typically vote, below the U.S. average of about 62%. Among adults in Tyndall AFB, ~14% vote Democratic, ~26% Republican, and ~60% don't vote. The map below shows estimated turnout by block group.
How Tyndall AFB compares
Among cities within 25 miles, Tyndall AFB leans more Republican than 3 of 18 neighbors.
Tyndall AFB runs about 18 points more Republican than Florida as a whole.
Why Tyndall AFB leans the way it does
This analysis examined 14,881 data points per city to find what predicts political lean and turnout. The items below are a few correlations that stood out for Tyndall AFB, not a ranked or complete list of what matters most.
Areas with many family households vote Republican. More than 99% of households in Tyndall AFB are family households, about 33 points above the U.S. average of 67%.
Population density and Republican lean
Places with low population density tend to lean Republican; Tyndall AFB, FL sits in the bottom quarter nationally on this measure.
Why turnout in Tyndall AFB looks the way it does
Renters vote less often than owners. More than 99% of households in Tyndall AFB rent, about 75 points above the U.S. average of 25%. Strong routine healthcare access lines up with higher turnout, and Tyndall AFB sits in the top quarter on routine-care measures. Learn more about the findings and methodology on the political spectrum map.
Nearby Cities
- Parker, FL R+27
- Callaway, FL R+26
- Springfield, FL R+18
- Pretty Bayou, FL R+32
- Panama City, FL R+31
- Lower Grand Lagoon, FL R+37
- Upper Grand Lagoon, FL R+40
- Lynn Haven, FL R+36
- West Bay, FL R+41
- Southport, FL R+65
Cities with Similar Populations
- Lunsford, AR R+68
- Lucile, ID R+65
- Cherrystone, VA D+6
- Maxine, WV R+64
- Leslie, KY R+71
- Paw Paw, OK R+61
- Staffordville, NJ R+34
- Henlopen Acres, DE D+22
- Henshaw, KY R+64
- Bryan, PA R+62
Sources and methodology
Precinct-level voting records used to fit the model come from Florida Division of Elections, distributed by the Voting and Election Science Team. Demographic inputs come from the U.S. Census Bureau (ACS 5-year estimates and the 2020 Decennial Census). Health and environmental inputs come from the CDC (PLACES and the Environmental Justice Index). Land cover comes from the USGS and EPA. Election-day and lead-up weather come from PRISM 4km daily grids and the NOAA Global Historical Climatology Network. Mail-voting and election-administration patterns come from the MIT Election Lab's Survey of the Performance of American Elections. Block-group crime detail comes from CrimeGrade. Internet data and modeling support provided by ISPreports.org.
Modeling and analysis by the BestNeighborhood data science team. Full methodology and findings: political spectrum map.
Methodology reviewed by the BestNeighborhood data team. Last updated May 2026.