Yuma County leans slightly Republican by roughly 8 points: about 46% of voters vote Democratic and 54% Republican.
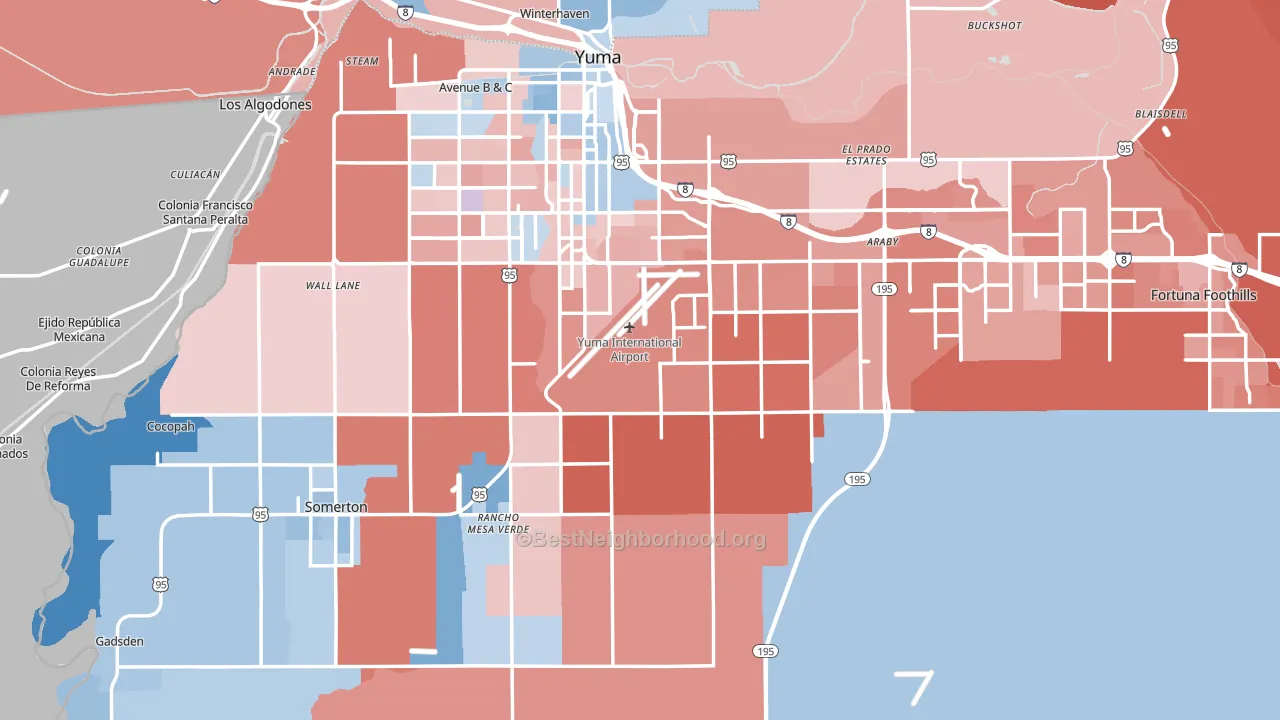
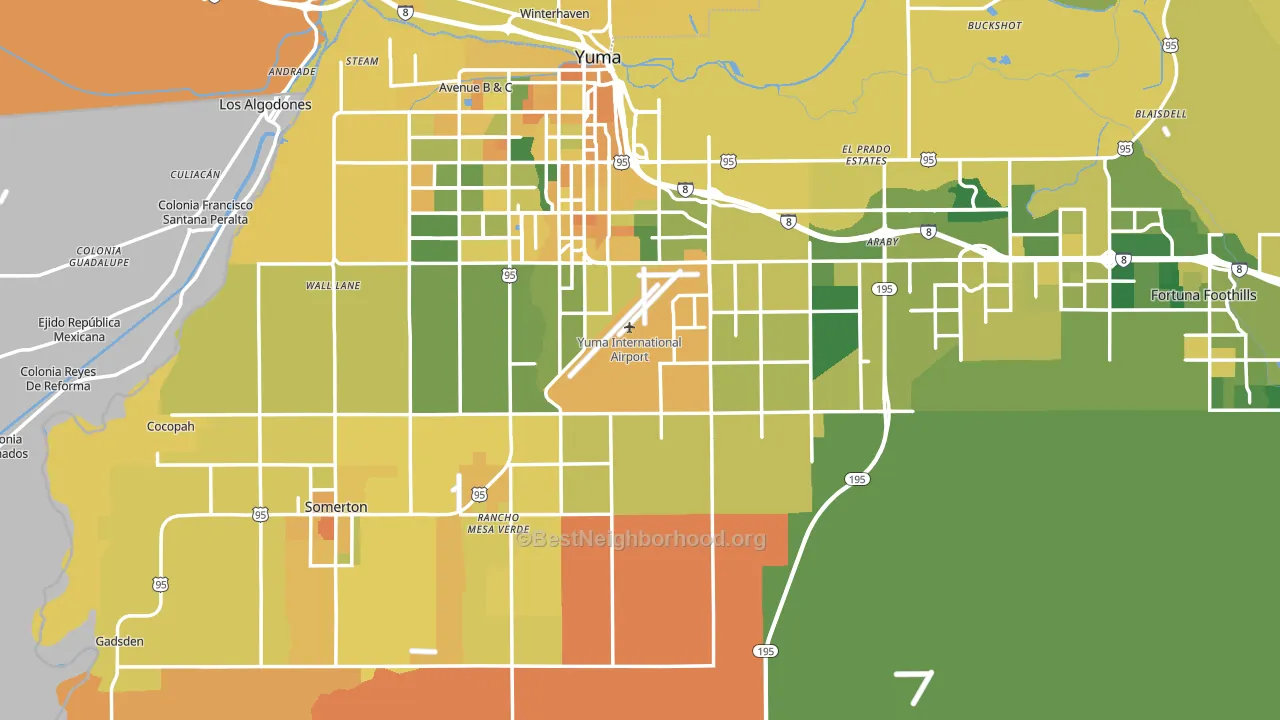
About 53% of adults in Yuma County typically vote, below the U.S. average of about 62%. Among adults in Yuma County, ~25% vote Democratic, ~29% Republican, and ~46% don't vote. The map below shows estimated turnout by block group.
How Yuma County compares
Politically, Yuma County sits close to the rest of Arizona.
Politics vary noticeably by city within Yuma County. The southwest side runs the most Democratic (D+5) and the northeast side runs the most Republican (R+44), a spread of about 49 points.
Why Yuma County leans the way it does
This analysis examined 14,881 data points per county to find what predicts political lean and turnout. The items below are a few correlations that stood out for Yuma County, not a ranked or complete list of what matters most.
Yuma County votes Republican even though it is densely developed (about 71%, far above the Arizona average of 39%). State and regional patterns outweigh the Democratic lean that density usually predicts here. A high family-household share predicts Republican voting, and about 74% of households in Yuma County are family households, above 94% of counties.
High-school completion, developed land, and voter turnout
Places that combine low high-school-completion share and a heavily developed built environment tend to turn out at a lower rate, as Yuma County, AZ does.
Why turnout in Yuma County looks the way it does
Areas with limited routine healthcare access turn out at lower rates. Yuma County is in the bottom quarter nationally for routine-care measures such as insurance coverage, preventive screenings, and dental visits. The dental-visit rate here is about 50%, about 10 points below the U.S. average of 60%. High food insecurity lines up with lower turnout, and about 26% of adults in Yuma County report food insecurity, above 90% of counties. Low high-school completion lines up with lower turnout, and about 77% of adults in Yuma County have completed high school, below 97% of counties. Learn more about the findings and methodology on the political spectrum map.
Nearby Counties
- Imperial County, CA Even
- La Paz County, AZ R+28
- San Diego County, CA D+17
- Maricopa County, AZ D+3
- Riverside County, CA Even
- Mohave County, AZ R+37
- Pinal County, AZ R+16
- San Bernardino County, CA Even
- Yavapai County, AZ R+22
- Orange County, CA D+6
Counties with Similar Populations
- Anderson County, SC R+43
- Onslow County, NC R+23
- Hall County, GA R+32
- Trumbull County, OH R+17
- Champaign County, IL D+29
- Richmond County, GA D+41
- Benton County, WA R+21
- Muscogee County, GA D+25
- Elkhart County, IN R+28
- Hawaii County, HI D+20
Sources and methodology
Precinct-level voting records used to fit the model come from Arizona Secretary of State, Elections, distributed by the Voting and Election Science Team. Demographic inputs come from the U.S. Census Bureau (ACS 5-year estimates and the 2020 Decennial Census). Health and environmental inputs come from the CDC (PLACES and the Environmental Justice Index). Land cover comes from the USGS and EPA. Election-day and lead-up weather come from PRISM 4km daily grids and the NOAA Global Historical Climatology Network. Mail-voting and election-administration patterns come from the MIT Election Lab's Survey of the Performance of American Elections. Block-group crime detail comes from CrimeGrade. Internet data and modeling support provided by ISPreports.org.
Modeling and analysis by the BestNeighborhood data science team. Full methodology and findings: political spectrum map.
Methodology reviewed by the BestNeighborhood data team. Last updated May 2026.