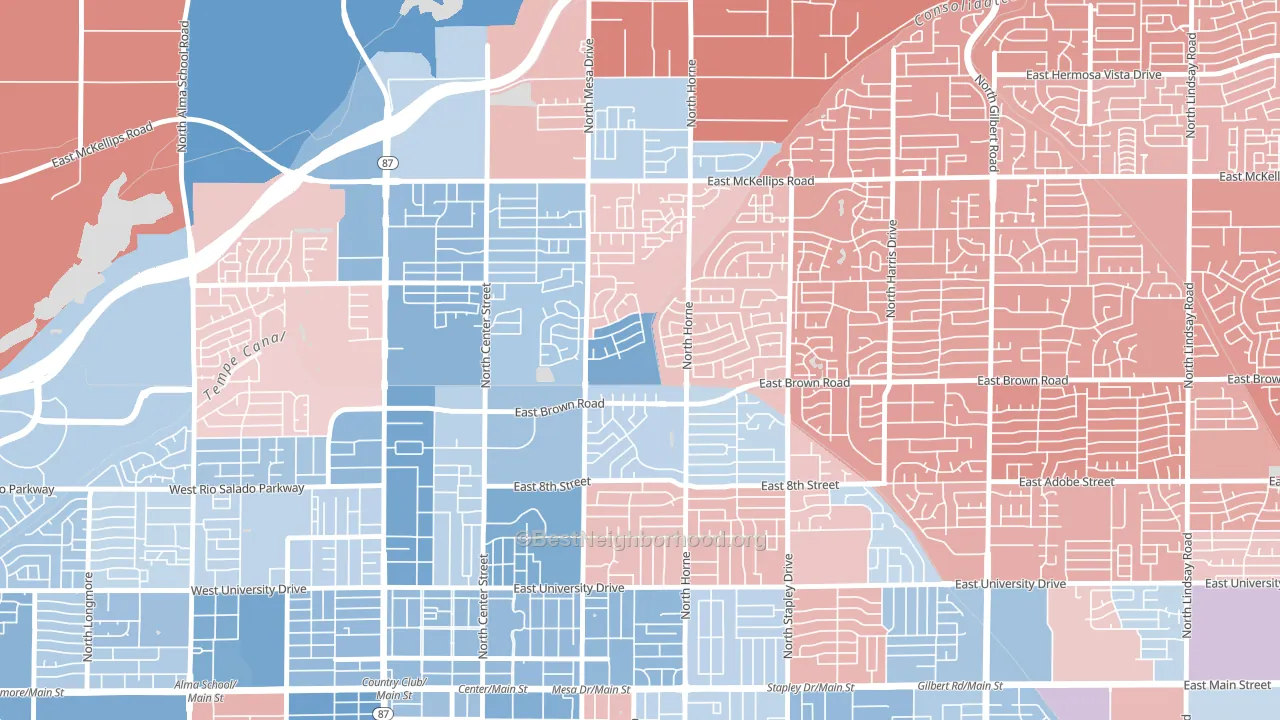
Hohokam Village leans slightly Democratic by roughly 8 points: about 54% of voters vote Democratic and 46% Republican.
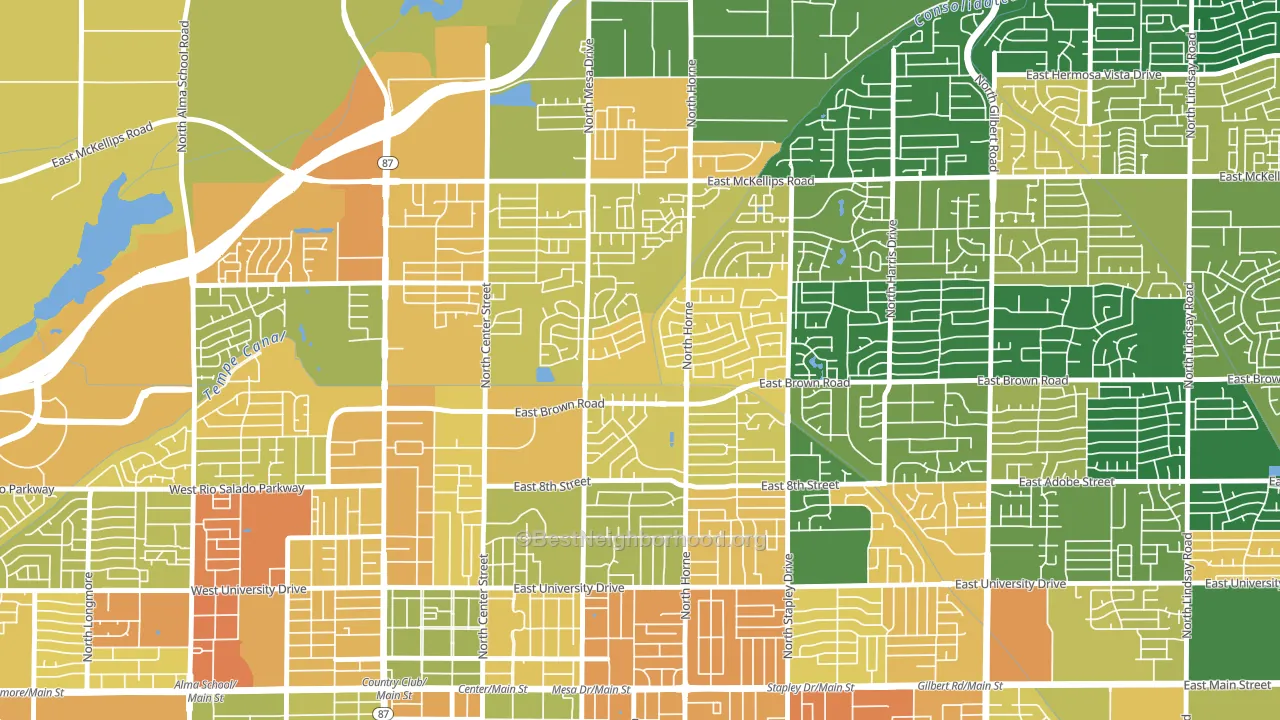
About 50% of adults in Hohokam Village typically vote, below the U.S. average of about 62%. Among adults in Hohokam Village, ~27% vote Democratic, ~23% Republican, and ~50% don't vote. The map below shows estimated turnout by block group.
How Hohokam Village compares
Among neighborhoods within 5 miles, Hohokam Village leans more Democratic than 2 of 5 neighbors.
Hohokam Village runs about 14 points more Democratic than Arizona as a whole. Arizona leans Republican overall, while Hohokam Village is one of the few Democratic-leaning pockets.
Politics vary noticeably by block within Hohokam Village. The west side runs the most Democratic (D+22) and the east side runs the most Republican (R+3), a spread of about 25 points.
Why Hohokam Village leans the way it does
This analysis examined 14,881 data points per neighborhood to find what predicts political lean and turnout. The items below are a few correlations that stood out for Hohokam Village, not a ranked or complete list of what matters most.
Hohokam Village votes against the grain of Arizona. Arizona leans Republican overall, while Hohokam Village runs about 14 points more Democratic.
Park access and Democratic lean
Places with heavy park coverage tend to lean Democratic; Hohokam Village, Mesa, AZ sits in the top quarter nationally on this measure. Park access does not change how people vote; it tends to track denser, higher-income areas.
Why turnout in Hohokam Village looks the way it does
Crowded housing lines up with lower turnout. About 6% of homes in Hohokam Village have more than one occupant per room, above 82% of neighborhoods. Learn more about the findings and methodology on the political spectrum map.
Nearby Neighborhoods
- Woodridge Lakes, Mesa, AZ R+12
- West Central, Mesa, AZ D+17
- Central Mesa, Mesa, AZ R+6
- Escalante, Tempe, AZ D+31
- Southwest Mesa, Mesa, AZ D+14
- Heritage District, Gilbert, AZ D+5
- Meyer Park, Tempe, AZ D+29
- Downtown Tempe, Tempe, AZ D+38
- South Scottsdale, Scottsdale, AZ D+7
- The Islands, Gilbert, AZ R+5
Neighborhoods with Similar Populations
- Heart of Missoula, Missoula, MT D+51
- Wyatt Street, Largo, FL D+8
- Sugar Pond Manor of Wellington, Wellington, FL R+6
- Lakewide, Oakland, CA D+75
- US Navy Little Creek Amphibious Base, Norfolk, VA D+7
- Victory Hills, Albuquerque, NM D+51
- Martin Luther King, Chattanooga, TN D+36
- Cherrydale, Arlington, VA D+57
- West Gate, Austin, TX D+48
- Southside University, St. Cloud, MN D+29
Sources and methodology
Precinct-level voting records used to fit the model come from Arizona Secretary of State, Elections, distributed by the Voting and Election Science Team. Demographic inputs come from the U.S. Census Bureau (ACS 5-year estimates and the 2020 Decennial Census). Health and environmental inputs come from the CDC (PLACES and the Environmental Justice Index). Land cover comes from the USGS and EPA. Election-day and lead-up weather come from PRISM 4km daily grids and the NOAA Global Historical Climatology Network. Mail-voting and election-administration patterns come from the MIT Election Lab's Survey of the Performance of American Elections. Block-group crime detail comes from CrimeGrade. Internet data and modeling support provided by ISPreports.org.
Modeling and analysis by the BestNeighborhood data science team. Full methodology and findings: political spectrum map.
Methodology reviewed by the BestNeighborhood data team. Last updated May 2026.